WinZPV
Copyright ©2001-2005 Ing. Tomáš Rylek, Hydrosoft Veleslavín, spol. s r.o.
This is a complex information system used by the Czech Hydrological Institute to record river water measurements (water levels and flow rates, temperatures and lots of other silly things) and various additional information used to analyze various aspects of the Czech river network system.
Database technology:
|
Oracle 8 (OCI)
|
Source files:
|
140 files in 1 special package plus 30 uppsrc packages
|
Number of lines:
|
cca 70000 (not including the uppsrc packages)
|
Application style:
|
combined database & graphical editation (typical windows are combined alphanumerical & graphical data based on a set of database tables)
|
Distinctive features:
|
Heavy use of vector graphics (lots of charts and diagrams), a multitude of specialized controls, a moderately complex data model. The charts can be combined in a layer-like manner and subjected to various calculations (interpolations and extrapolations, layer data joins, statistical calculations).
|
|
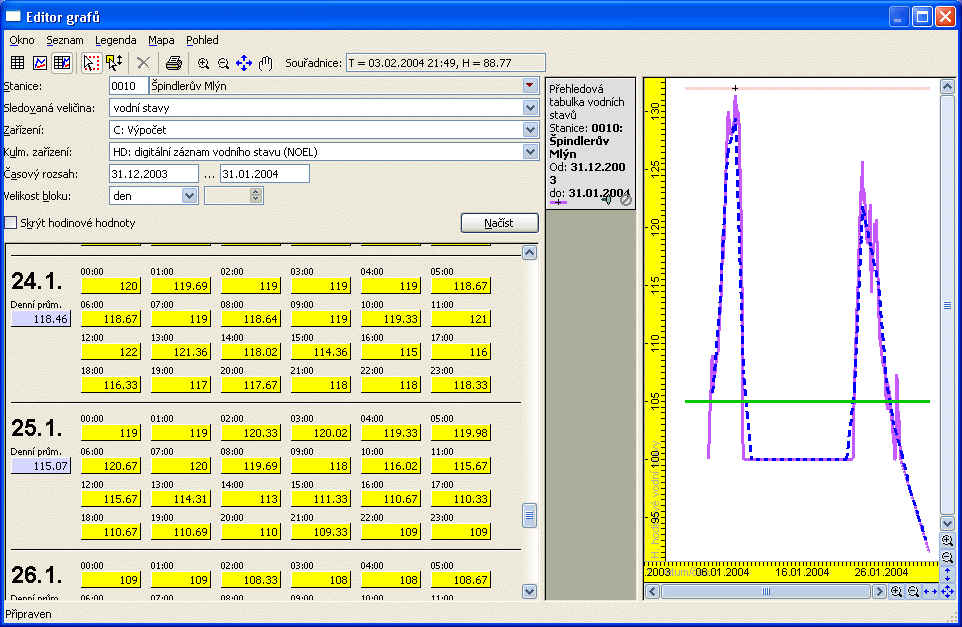
This is a typical WinZPV window used to edit water level / flow rate time series. There are day and hour series (the table on the left), the time series can be edited either numerically (in the table on the left) or graphically using drag & drop in the chart.
Another chart window used to calculate quadratic interpolation of a given set of points with heavy noise. You can either use the least square method to calculate an automatic interpolation or use drag & drop in the chart to adjust the analytic curve manually.

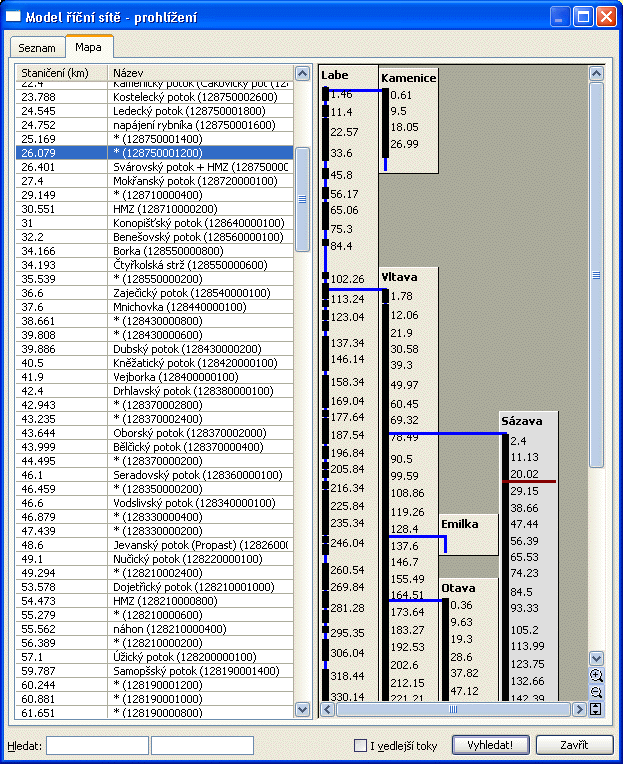
The application has many dialog windows (about 170) and defines some non-trivial specialized controls. This is an example of a tree-like control used to display and edit the river network information. The table on the left displays the kilometer distances and side flows of the currently selected river, the table on the right displays the currently open part of the river network graphically.
Template-driven readouts are used for a wide range of reporting functions. Other features in this area include user-defined data exports and imports from/to text and DBF files.

|