| Re: New graph packages [message #35826 is a reply to message #35680] |
Mon, 26 March 2012 23:53   |
 Didier
Messages: 740
Registered: November 2008
Location: France
|
Contributor |
|
|
Hi all,
My graph package is taking form so I'm going to publish a first version.
The design guideline I followed was to make it the most configurable possible, in order to be able to do a lot of things (at least for 2D graphs)
GraphDraw is based on the followinf principles:
- A coordinate manager is in charge of each graph<->screen conversion => a unique instance is used for plotting, grid/axis management
- The plot can be decorated with "GraphElements" (Left, right, top, bottom, over the whole graph, ...) just like Ctrls.
They are stacked on each side of the plot. You can create whatever class you need for you're graph (like drawing exclusion zones on a graph, ...)
One nice feature of GraphElements is that they have a callback that is called when mouse clicks on it ==> In the example try clicking on the axis

- The Grid and Axis drawing are grouped in one class that can be overloaded (in fact it is a GraphElement)
- The tick management is dedicated to a specific class: GridStepManager : it calculates the positions where ticks/grid needs to be drawn. The intent of this class is to allow custom step calculation (log, ...)
The main classes are:
- CoordinateConverter : it manages the coordinate conversion and can be overloaded for custom needs
- GraphLementFrame :
- GridAxisDraw
- GridStepManager
- GraphDraw
- EmptyGraphDraw |
- StdGraphDraw | helper classes intended to ease the use
The code is pretty dirty and not cleaned at all ( lots and lots of templates, I will kick them out once architecture and optimisations are finished )
The easyest way to use it to use the 'StdGraphCtrl' as in the example
Many functions are missing (zoom, scroll, ...) but the code architecture is pretty much finished although a lot of work is still to be done .
The data management is 100% compatible with ScatterDraw since it uses the same interface.
You can put as many axis as you wan't
[Updated on: Tue, 27 March 2012 00:02] Report message to a moderator |
|
|
|
|
|
|
|
|
|
|
|
|
|
| Re: New graph packages [message #36020 is a reply to message #35991] |
Thu, 19 April 2012 14:42 |
Didier
Messages: 740
Registered: November 2008
Location: France
|
Contributor |
|
|
Hi Koldo,
While retreiving the DrawLegend code of ScatterCtrl to inject it into GraphDraw, I found a bug:
At ScatterDraw.cpp L192
if (series[i].opacity > 0 && series[j].seriesPlot)
sould be replace by:
if (series[i].opacity > 0 && series[i].seriesPlot)
j ==> i
[Updated on: Thu, 19 April 2012 14:43] Report message to a moderator |
|
|
|
|
|
| Re: New graph packages [message #36128 is a reply to message #36030] |
Tue, 01 May 2012 22:50 |
Didier
Messages: 740
Registered: November 2008
Location: France
|
Contributor |
|
|
My GraphDraw / GraphCtrl packages are progressing:
Here are the latest evolutions (all in svn sandbox):
- Corrected all the series drawing in order to work with all ScatterDraw SeriesPlots
- Corrected LOG (works with zoom/scroll)
- Corrected SCALING
- Added the copy/save image functions
- Added a ScatterCtrl replacement (just to profit the ScatterCtrl_demo). It is not a full replacement (all mouse config is not replaced, but all the rest works )
RECALL: The intent of this package is to give the maximum of flexibility in graph, so it inherits a lot from ScatterCtrl while adding different code strucure and some enhancements:
- add different drawing schemes easily : axis/grids/legend/... while keeping UI reactions factored
- Zooming/Scrolling is a factored functionality
- Code Structure is a "ctrl like" => the graph is made of a plot zone + other "ctrls" adding axis/grids/legends/labels/spaces/.... whatever you invent
- You can put as many axis as you wan't (just as long as it's useful
 ) )
Next modifications in the list:
- Add zoom/scroll SLAVE mechanism ==> so you can synchronize several graphs together or make a global view that manages the local zoom/pan
- Make a grid dedicated to LOG
- Add axis text formating (printing dates, ...)
- Documentation (not started yet)
[Updated on: Tue, 01 May 2012 22:51] Report message to a moderator |
|
|
|
|
|
|
|
|
|
| Re: New graph packages [message #36881 is a reply to message #36880] |
Mon, 16 July 2012 22:02 |
|
|
| 281264 wrote on Mon, 16 July 2012 21:35 |
Hi,
I would like to use this graphs/plots packages but it seems to be more than one package; for instance, in bazaar you can find PlotCtrl/PlotLib but there are others.
Any suggestion about which of them to use? Apart from PlotCtrl/PlotLib that you can find in Bazaar, how can you get the other packages?.
Thank you,
Javier
|
Hi Javier,
PlotLib/PlotCtrl are slowly getting obsolete now. Koldo adapted the main features from them into the ScatterCtrl, so you should probably use that (unless you have some very specific needs).
Both Koldos and Didiers packages can be found in sandbox under the names ScatterCtrl and GraphDraw, respectively.
Best regards,
Honza
|
|
|
|
|
|
|
|
|
|
|
|
|
|
|
|
| Re: New graph packages [message #38902 is a reply to message #37345] |
Sat, 26 January 2013 20:13 |
Didier
Messages: 740
Registered: November 2008
Location: France
|
Contributor |
|
|
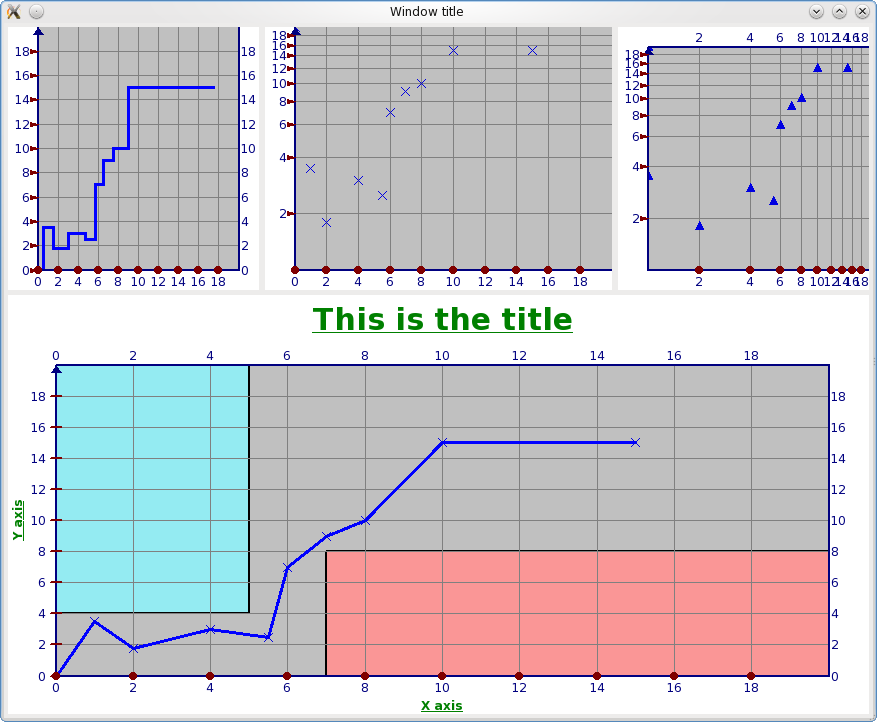
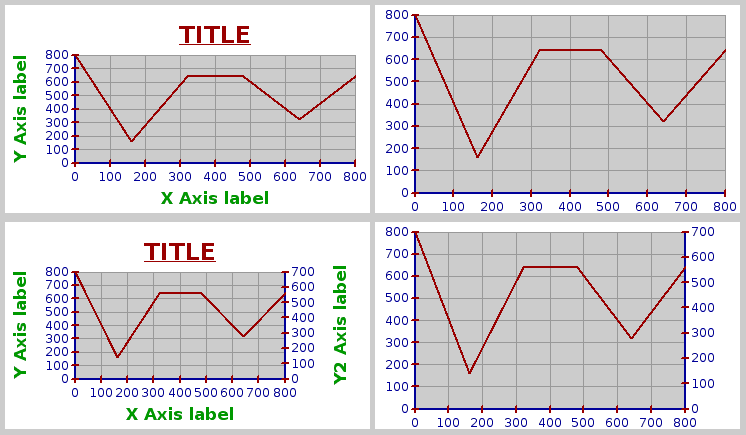
Hi all,
I just updated my GraphDraw/GraphCtrl Packages in the svn sandbox.
I added some predefined Graphs along with their description in '.usc' files to allow easy use in layout designer.
I tried to make the look in designer the closest possible to the real Graphs: so almost ALL parameters are modifiable directly in designer :
- colors
- fonts
- width
- margins
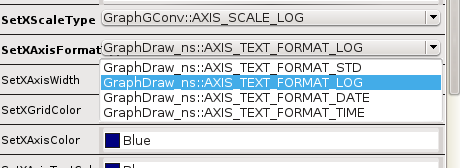
- axis scale type : STD/LOG
- Axis format type: STD/LOG/DATE/TIME
- Labels (axis labels, title)
- ... and more
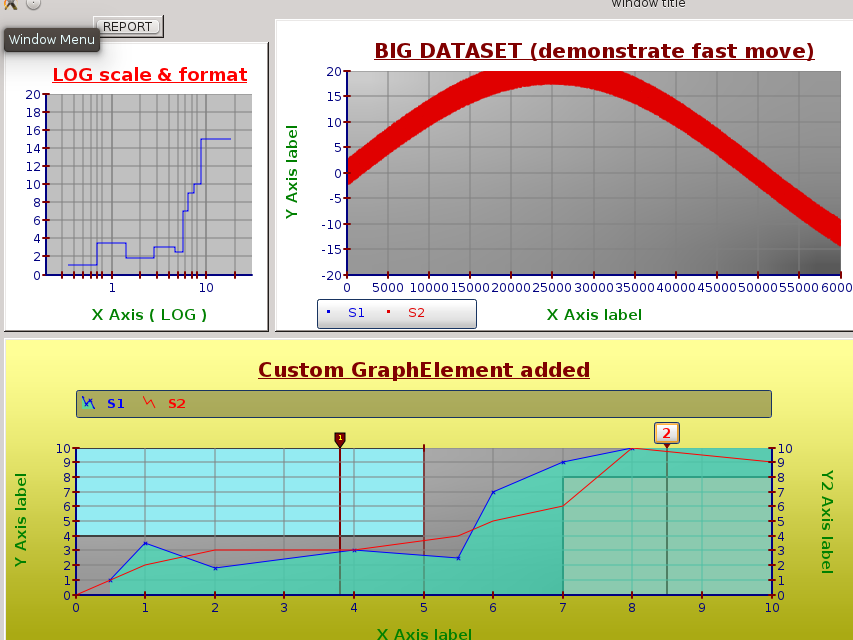
Here is how the four predefined graphs look when dropped in the designer
[Updated on: Sat, 26 January 2013 20:17] Report message to a moderator |
|
|
|
|
|
|
|
| Re: New graph packages [message #39064 is a reply to message #38972] |
Tue, 12 February 2013 00:08 |
Didier
Messages: 740
Registered: November 2008
Location: France
|
Contributor |
|
|
Hi all,
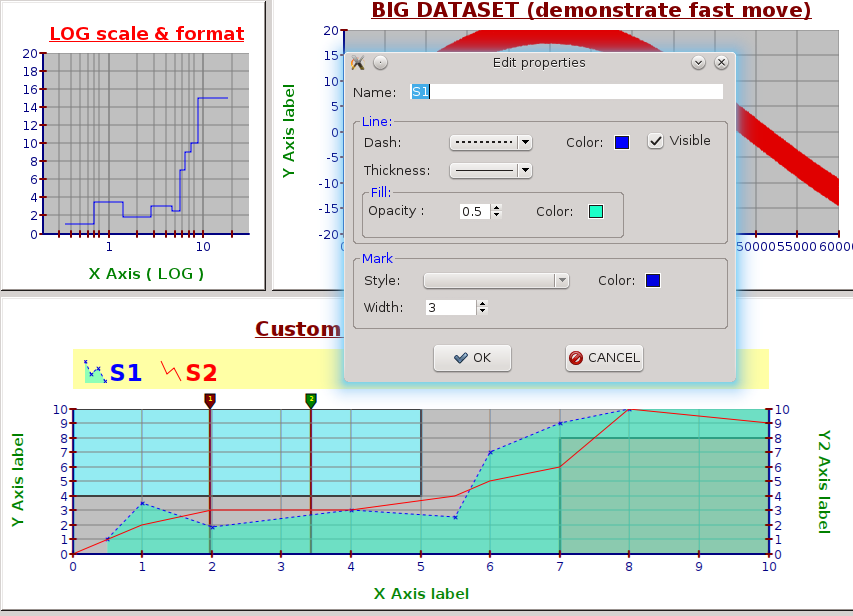
I uploaded a lot of corrections and changes including:
- popup menu for changing of element properties (only base properties for the moment)(legend, labels, title)
- popup menu for changing series properties
- series dynamic show/hide through popup menu
A lot of the code is still 'in progress' but things are coming to shape now (although some parts still need a heavy refactoring)
I will upload a new demo soon
[Updated on: Tue, 12 February 2013 00:11] Report message to a moderator |
|
|
|
| Re: New graph packages [message #39175 is a reply to message #39064] |
Fri, 22 February 2013 17:45 |
Didier
Messages: 740
Registered: November 2008
Location: France
|
Contributor |
|
|
Hi all,
I've uploaded some more corrections and enhancements since last post:
- Refactoring
- Bug corrections
- Added Label hide management in .usc
- WIN compile issue
- Mouse ctrl corrections for elements that are hidden
- Added LabelPropertiesEditorDlg
Has anybody tried this Ctrl ??
[Updated on: Fri, 22 February 2013 17:49] Report message to a moderator |
|
|
|
| Re: New graph packages [message #39826 is a reply to message #39175] |
Sat, 04 May 2013 15:18 |
Didier
Messages: 740
Registered: November 2008
Location: France
|
Contributor |
|
|
Hi all,
I've uploaded to svn sandbox some more corrections:
* compiles with lattest ScatterDraw modifications from Koldo
* other enhancements and corrections
* legend has exact same aspect as serie in the graph
* ...
EDIT: image deleted
[Updated on: Sun, 17 November 2013 00:48] Report message to a moderator |
|
|
|
|
|
|
|
| Re: New graph packages [message #39976 is a reply to message #39974] |
Wed, 22 May 2013 03:49 |
jerson
Messages: 202
Registered: June 2010
Location: Bombay, India
|
Experienced Member |

|
|
I am not sure if this has already been covered in the widget. However, couple of things which I have used in the past have been a LOG-LOG scale and NYQUIST(also known as Polar) plot.
The nyquist plot would make the graph pretty complete in all respects and adding it is just a variation of pie. I could try, but, as you would realize, I am not upto speed with this right now. This would make it useful to many engineers.
This is what I mean by nyquist plot
Picked the reference from this link
[Updated on: Wed, 22 May 2013 03:51] Report message to a moderator |
|
|
|
| Re: New graph packages [message #39989 is a reply to message #39976] |
Wed, 22 May 2013 22:02 |
Didier
Messages: 740
Registered: November 2008
Location: France
|
Contributor |
|
|
Hi Jerson,
well if you want to have LOG/LOG : no problem, you can even configure it through LayoutDesigner.
You can even have LOG scaling while having normal style graduation, all is configurable ... and extensible
For the Nyquist graph, I don't have polar styled graph since I haven't needed it for now.
If I have time I may try ( but I don't garanty it )
[Updated on: Wed, 22 May 2013 22:03] Report message to a moderator |
|
|
|
|
|
| Re: New graph packages [message #40966 is a reply to message #38902] |
Mon, 14 October 2013 23:40 |
Didier
Messages: 740
Registered: November 2008
Location: France
|
Contributor |
|
|
Hi all,
I've updated GraphCtrl/GraphDraw packages in svn sandbox.
The following enhancements/corrections were done:
- correction : Mouse move management now uses LocalLoop to catch mouse when scrolling and remove a nasty bug when moving mouse from one graph to another
- Some cleaning up of code
- Added some documentation ( work in progress )
- Added FitToData() method (for each axis, and for all graph)
- Added UNDO/REDO capacities
- Added UNDO/REDO automatic merging ==> when actions are done very quickly(<500ms) (like wheel scroll or zoom), they are merged into ONE undo / redo action
Undo/redo works for all the move/scroll actions.
Properties undo/redo is next to come
[Updated on: Mon, 14 October 2013 23:41] Report message to a moderator |
|
|
|
| Re: New graph packages [message #41120 is a reply to message #40966] |
Fri, 01 November 2013 13:04 |
Didier
Messages: 740
Registered: November 2008
Location: France
|
Contributor |
|
|
Hi all,
Here comes the last updates concerning the GraphDraw/GraphCtrl. The following modifications have been made :
- Code cleaning / refactoring / reorganisation
- Undo/redo additions
- Undo/Redo refactoring to ease it's use in GraphElements
- Added MarkerElement/DynamicMarkerCtrl
- refactored TickMark class (needed for MarkerElement)
- Series Properties Dialog refactored
The main addition is the management of DynamicMarkers : it allows to manage markers that can be freely moved on the side of the graph (to measure distances ... or anything else). It is still work in progress (how to pass parameters to TickMark classes ) but a working example is show in GraphCtrl_test Package
The look and feel of the markers used is completely configurable and depends only on the TickMark class used
[Updated on: Fri, 01 November 2013 13:05] Report message to a moderator |
|
|
|
| Re: New graph packages [message #41201 is a reply to message #41120] |
Mon, 11 November 2013 23:00 |
Didier
Messages: 740
Registered: November 2008
Location: France
|
Contributor |
|
|
Hi all,
I just uploaded some more updates to GraphDraw/GraphCtrl.
The modifications brought are the following:
- DynamicMarker refactoring
- Added some skinning possibilities to the Graph and to the TickMarks used for DynamicMarkers
- some code cleaning
- some documentation
The next modifications to come :
Their is an issue when moving a marker with the mouse ==> all the graphs get's drawn ... so if the grap has big data, moving the marker is not smooth : I will try to correct this point.
[Updated on: Mon, 11 November 2013 23:10] Report message to a moderator |
|
|
|
| Re: New graph packages [message #41231 is a reply to message #41201] |
Sun, 17 November 2013 00:47 |
Didier
Messages: 740
Registered: November 2008
Location: France
|
Contributor |
|
|
Hi all,
I just uploaded some updates :
- DynamicMarker::CursorImage() correction
- Code cleaning / refactoring
- DOCUMENTATION (big effort)
- Added WhenMove callbacks to DynamicMarker and added example usage in GraphCtrl_test
The documentation is now starting to be consistant but there is still much to do.
If someone reads the doc and has remarks (phrase not clear enough for example), I'll be glad to take into account the remarks
[Updated on: Sun, 17 November 2013 00:47] Report message to a moderator |
|
|
|
|
|
|
|
| Re: New graph packages [message #41614 is a reply to message #41507] |
Sun, 05 January 2014 23:48 |
Didier
Messages: 740
Registered: November 2008
Location: France
|
Contributor |
|
|
Hi all,
I just delivered to svn sandbox an update of GraphDraw/GraphCtrl.
The modifications are listed below:
* GraphElementCtrl_FloatMoveResize : improved re-size with full border/corner selection and adapted MouseCursor when resizing
* Added LocalLoopSelect & Select style in GraphCtrl
......* In fact this draws nice blue transparent rectangles instead of the animated rectangle obtained using RectTracker
......* Select Rect style is completelly configurable ( Blue is default )
* StdGridAxisDrawCtrl:
* Added AXIS SELECT-ZOOM
......* Added LocalLoopSelect
......* Added configurable select style
* Added global KEY management ==> replace K_CTRL, ... by predefined constants K_ZOOM, K_SCROLL, ...
only a starting point, may do more if needed
* BUG : Corrected BUGs when LEFTMOUSE pressed outside GRAPH and moves into graph area
* Undo stack :
......* Added isModified Verification before adding UndoAction to UNDO STACK
......* Added UNDOSTACK limitation (100 undo actions max by default )
* Layout() requests :
......* Painting done in 'fastPaint' mode when requested by Layout() ==> Application resizing
......* Added FULL repaint 300 ms after last Layout() request
......==> this gives fluid application re-size (no app freeze when re-sizing)
* Add AllowZoom, AllowScroll for X/Y management
* Added additional methods in GraphCtrl.usc
......* UseLocalSelectLoop
......* DisableGraphZoom
......* DisableGraphScroll
......* DisableXZoom
......* DisableYZoom
......* DisableXScroll
......* DisableYScroll
......* DisableAxisScroll
......* DisableAxisZoom
The major improvements are:
* Stylable selection rectangle
* no app freeze when re-sizing application (in case of big data)
* Zoom/Scroll authorizations completely configurable through layout designer
[Updated on: Sun, 05 January 2014 23:50] Report message to a moderator |
|
|
|
|
|
|
|
| Re: New graph packages [message #41699 is a reply to message #41689] |
Sat, 11 January 2014 14:59 |
ManfredHerr
Messages: 67
Registered: February 2013
Location: Germany
|
Member |
|
|
 I got it! Thank you very much for the prompt response! I got it! Thank you very much for the prompt response!
Merci beaucoup!
Edit:
I tried to have fun with it a little bit and detected an issue:
If you drag in the "Big Data" Area and move the hand outside the window before you release the mouse button then no update of the graph takes place unless you enter the window again. Is this intended?
[Updated on: Sat, 11 January 2014 17:44] Report message to a moderator |
|
|
|
 U++ framework


