Home » Community » U++ community news and announcements » Core 2019
|
|
| Re: Core 2019 [message #51814 is a reply to message #51812] |
Fri, 07 June 2019 17:51   |
 Novo
Novo
Messages: 1433
Registered: December 2006
|
Ultimate Contributor |
|
|
Thanks a lot!
One of my data-intensive MT apps is running ~20% faster now.
It looks like it is using 4 to 6 times more RAM.
And I'm getting a timing report, which, probably, should be disabled:
TIMING Large Alloc 2  : 808.40 ms -  1.27 us (825.00 ms / 636928 ), min:  0.00 ns, max: 17.00 ms, nesting: 0 - 636928
TIMING Large Alloc    :  1.97 s  - 167.81 ns ( 2.27 s  / 11734322 ), min:  0.00 ns, max: 28.00 ms, nesting: 0 - 11734325
Regards,
Novo
[Updated on: Fri, 07 June 2019 17:52] Report message to a moderator |
|
|
|
| Re: Core 2019 [message #51815 is a reply to message #51814] |
Fri, 07 June 2019 18:01 |
 |
mirek
Messages: 14291
Registered: November 2005
|
Ultimate Member |
|
|
Novo wrote on Fri, 07 June 2019 17:51Thanks a lot!
One of my data-intensive MT apps is running ~20% faster now.
It looks like it is using 4 to 6 times more RAM.
How do you measure it?
The new thing is that we now allocate 224MB chunks of _address space_. So virtual memory is way up, but that is not what physical memory use is....
Quote:
And I'm getting a timing report, which, probably, should be disabled:
TIMING Large Alloc 2  : 808.40 ms -  1.27 us (825.00 ms / 636928 ), min:  0.00 ns, max: 17.00 ms, nesting: 0 - 636928
TIMING Large Alloc    :  1.97 s  - 167.81 ns ( 2.27 s  / 11734322 ), min:  0.00 ns, max: 28.00 ms, nesting: 0 - 11734325
Thanks!
Mirek
|
|
|
|
| Re: Core 2019 [message #51817 is a reply to message #51815] |
Fri, 07 June 2019 23:00 |
Novo
Messages: 1433
Registered: December 2006
|
Ultimate Contributor |
|
|
mirek wrote on Fri, 07 June 2019 12:01Novo wrote on Fri, 07 June 2019 17:51Thanks a lot!
One of my data-intensive MT apps is running ~20% faster now.
It looks like it is using 4 to 6 times more RAM.
How do you measure it?
The new thing is that we now allocate 224MB chunks of _address space_. So virtual memory is way up, but that is not what physical memory use is....
I'm using old-fashioned top (a Linux tool). I was looking at %MEM and at RES.
To be precise, the difference is ~2.75 times and not 4 or 6 times as I mentioned before.
I measured the same app compiled against git:40cd0fd5e (svn://ultimatepp.org/upp/trunk@13354) and git: 8e0f32d6262 (svn://ultimatepp.org/upp/trunk@13368)
With the old allocator I was getting 0.8% RAM max (~260Mb). The app was running for 292 s.
With the new one I got 2.2% RAM max (~714Mb). Now it takes 230 s. to run it. This is one minute less, and that is cool.
A singly-threaded version of the same app has improved a little bit as well: 2428.33 s. vs 2491.37 s.
The difference is ~2.5%
Regards,
Novo
[Updated on: Sat, 08 June 2019 05:36] Report message to a moderator |
|
|
|
| Re: Core 2019 [message #51826 is a reply to message #51817] |
Sat, 08 June 2019 18:30 |
Novo
Messages: 1433
Registered: December 2006
|
Ultimate Contributor |
|
|
I couldn't compile code with the flag .USEMALLOC defined. I'm getting this:
error: use of undeclared identifier 'MemoryTryRealloc'
I just wanted to compare the new U++ allocator with the standard one ...
Regards,
Novo
|
|
|
|
|
|
|
|
| Re: Core 2019 [message #51829 is a reply to message #51828] |
Sat, 08 June 2019 19:44 |
Novo
Messages: 1433
Registered: December 2006
|
Ultimate Contributor |
|
|
mirek wrote on Sat, 08 June 2019 12:40USEMALLOC fixed
For some weird reason I'm getting a linker error (full rebuild)
in function `Upp::sProfile(Upp::MemoryProfile const&)':
/home/ssg/dvlp/cpp/upp/git/uppsrc/CtrlLib/CtrlUtil.cpp:368: undefined reference to `Upp::AsString(Upp::MemoryProfile const&)'
Configuration: Debug (Release is fine)
Flags: GUI .USEMALLOC
I'm not getting any problems with linking when flags are "MT .USEMALLOC".
BLITZ is used in all cases.
This is weird.
Regards,
Novo
[Updated on: Sat, 08 June 2019 19:46] Report message to a moderator |
|
|
|
|
|
| Re: Core 2019 [message #51833 is a reply to message #51826] |
Sat, 08 June 2019 21:42 |
Novo
Messages: 1433
Registered: December 2006
|
Ultimate Contributor |
|
|
Novo wrote on Sat, 08 June 2019 12:30
I just wanted to compare the new U++ allocator with the standard one ...
So, StdAlloc-based MT version runs for 233 s. and it is using 1.6% RAM max (~541Mb).
It is somewhere in-between the new and the old U++ allocator.
Regards,
Novo
[Updated on: Sun, 09 June 2019 05:15] Report message to a moderator |
|
|
|
| Re: Core 2019 [message #51834 is a reply to message #51830] |
Sat, 08 June 2019 21:45 |
Novo
Messages: 1433
Registered: December 2006
|
Ultimate Contributor |
|
|
mirek wrote on Sat, 08 June 2019 14:38Hopefully fixed.
Mirek
Everything is fine now.
Thank you!
Regards,
Novo
|
|
|
|
| Re: Core 2019 [message #51835 is a reply to message #51827] |
Sat, 08 June 2019 21:54 |
Novo
Messages: 1433
Registered: December 2006
|
Ultimate Contributor |
|
|
mirek wrote on Sat, 08 June 2019 12:31
We can test this. In HeapImp.h, there is HPAGE constant. This is the size of "master chunk" (in 4KB units) and also maximum size of block that allocator keeps for reuse. Try to change that to something smaller, like 256 and retest...
Mirek
In case of HPAGE = 256 it is starting to use tens of gigabytes in just a few seconds ...
Regards,
Novo
|
|
|
|
| Re: Core 2019 [message #51836 is a reply to message #51835] |
Sat, 08 June 2019 22:06 |
Novo
Messages: 1433
Registered: December 2006
|
Ultimate Contributor |
|
|
Novo wrote on Sat, 08 June 2019 15:54
In case of HPAGE = 256 it is starting to use tens of gigabytes in just a few seconds ...
In case of HPAGE = 8192 it is using 2.0% RAM max (~646Mb) one one (some data is read from disc into memory) run
and 2.2% RAM max (~714Mb) on another run (all data is cashed in memory).
Well, "top" is not the best tool to check memory usage.
Regards,
Novo
[Updated on: Sun, 09 June 2019 04:54] Report message to a moderator |
|
|
|
|
|
|
|
| Re: Core 2019 [message #51844 is a reply to message #51840] |
Sun, 09 June 2019 16:33 |
|
mirek
Messages: 14291
Registered: November 2005
|
Ultimate Member |
|
|
Novo wrote on Sun, 09 June 2019 15:20mirek wrote on Sun, 09 June 2019 04:03Novo wrote on Sat, 08 June 2019 21:54mirek wrote on Sat, 08 June 2019 12:31
We can test this. In HeapImp.h, there is HPAGE constant. This is the size of "master chunk" (in 4KB units) and also maximum size of block that allocator keeps for reuse. Try to change that to something smaller, like 256 and retest...
Mirek
In case of HPAGE = 256 it is starting to use tens of gigabytes in just a few seconds ...
Now that is an excelent clue 
Found and fixed a bug (stupid one really). Can you test now please?
Mirek
HPAGE = 256
ram: 308 Mb, time: 253 s.
OK, at least the bug was fixed...
Quote:
HPAGE = 7 * 8192
ram: 714 Mb, time: 232 s.
StdAlloc still remains the best choice for MT ...
Can you try some other value, like 4096 or 8192...
Anyway, maybe this is really only misinterpreted reporting. The idea was that if I allocate a lot of address space, it is not really in physical memory unless written to.
Mirek
|
|
|
|
|
|
| Re: Core 2019 [message #51846 is a reply to message #51844] |
Sun, 09 June 2019 17:02 |
Novo
Messages: 1433
Registered: December 2006
|
Ultimate Contributor |
|
|
mirek wrote on Sun, 09 June 2019 10:33
Can you try some other value, like 4096 or 8192...
Anyway, maybe this is really only misinterpreted reporting. The idea was that if I allocate a lot of address space, it is not really in physical memory unless written to.
Mirek
HPAGE = 4096
mem: 680 Mb, time: 232 s.
HPAGE = 8192
mem: 777 Mb, time: 232 s.
If I remember correctly, some of the system allocation routines initialize allocated memory with zeros even if you do not write there anything ...
Regards,
Novo
|
|
|
|
| Re: Core 2019 [message #51847 is a reply to message #51846] |
Sun, 09 June 2019 17:15 |
Novo
Messages: 1433
Registered: December 2006
|
Ultimate Contributor |
|
|
I hacked your TIMING macro and made a similar RMEMUSE one:
namespace Upp {

struct MemInspector {
protected:
	static bool active;

	const char *name;
	int         call_count;
	int         min_mem;
	int         max_mem;
	int         max_nesting;
	int         all_count;
	StaticMutex mutex;

public:
	MemInspector(const char *name = NULL); // Not String !!!
	~MemInspector();

	void Add(int mem, int nesting);

	String Dump();

	class Routine {
	public:
		Routine(MemInspector& stat, int& nesting)
		: nesting(nesting), stat(stat) {
			++nesting;
		}

		~Routine() {
			--nesting;
			int mem = MemoryUsedKb();
			stat.Add(mem, nesting);
		}

	protected:
		int& nesting;
		MemInspector& stat;
	};

	static void Activate(bool b) { active = b; }
};

bool MemInspector::active = true;

MemInspector::MemInspector(const char *_name) {
	name = _name ? _name : "";
	all_count = call_count = max_nesting = min_mem = max_mem = 0;
}

MemInspector::~MemInspector() {
	Mutex::Lock __(mutex);
	StdLog() << Dump() << "\r\n";
}

void MemInspector::Add(int mem, int nesting)
{
	// mem = MemoryUsedKb() - mem;
	Mutex::Lock __(mutex);
	if(!active) return;
	all_count++;
	if(nesting > max_nesting)
		max_nesting = nesting;
	if(nesting == 0) {
		if(call_count++ == 0)
			min_mem = max_mem = mem;
		else {
			if(mem < min_mem)
				min_mem = mem;
			if(mem > max_mem)
				max_mem = mem;
		}
	}
}

String MemInspector::Dump() {
	Mutex::Lock __(mutex);
	String s = Sprintf("MEMUSE %-15s: ", name);
	if(call_count == 0)
		return s + "No active hit";
	return s
		   << "min: " << min_mem
		   << ", max: " << max_mem
		   << Sprintf(", nesting: %d - %d", max_nesting, all_count);
}


}

#define RMEMUSE(x) \
	static UPP::MemInspector COMBINE(sMemStat, __LINE__)(x); \
	static thread_local int COMBINE(sMemStatNesting, __LINE__); \
	UPP::MemInspector::Routine COMBINE(sMemStatR, __LINE__)(COMBINE(sMemStat, __LINE__), COMBINE(sMemStatNesting, __LINE__))
What I'm getting in case of HPAGE = 7 * 8192 is
TIMING Chunk          : 4108.80 s  - 22.66 ms (4108.80 s  / 181363 ), min:  1.00 ms, max:  1.24 s , nesting: 0 - 181363
MEMUSE Chunk          : min: 30844, max: 341052, nesting: 0 - 181363
TIMING Read Data      : 228.28 s  - 228.28 s  (228.28 s  / 1 ), min: 228.28 s , max: 228.28 s , nesting: 0 - 1
top is saying max used memory (RES) is ~771 Mb.
Regards,
Novo
|
|
|
|
| Re: Core 2019 [message #51848 is a reply to message #51845] |
Sun, 09 June 2019 17:34 |
Novo
Messages: 1433
Registered: December 2006
|
Ultimate Contributor |
|
|
mirek wrote on Sun, 09 June 2019 10:43Would it be possible to get peak memory profile?
Basically, you call PeakMemoryProfile at the start to activate it, then RDUMP(PeakMemoryProfile()) at the end of app. (Slows down the allocator).
Mirek
I'm calling PeakMemoryProfile(); before CoWork is created and RDUMP(*PeakMemoryProfile()); after it is destroyed.
*PeakMemoryProfile() = Memory peak 328920
  32 B,      13 allocated (     0 KB),    113 fragments (     3 KB)
  64 B,       8 allocated (     0 KB),     55 fragments (     3 KB)
  96 B,       6 allocated (     0 KB),     36 fragments (     3 KB)
 128 B,       3 allocated (     0 KB),     28 fragments (     3 KB)
 160 B,       3 allocated (     0 KB),     22 fragments (     3 KB)
 192 B,       2 allocated (     0 KB),     19 fragments (     3 KB)
 224 B,       3 allocated (     0 KB),     15 fragments (     3 KB)
 256 B,       2 allocated (     0 KB),     13 fragments (     3 KB)
 288 B,       2 allocated (     0 KB),     12 fragments (     3 KB)
 320 B,       2 allocated (     0 KB),     10 fragments (     3 KB)
 352 B,       1 allocated (     0 KB),     10 fragments (     3 KB)
 384 B,       2 allocated (     0 KB),      8 fragments (     3 KB)
 448 B,       2 allocated (     0 KB),      7 fragments (     3 KB)
 576 B,       4 allocated (     2 KB),      3 fragments (     1 KB)
 672 B,       3 allocated (     1 KB),      3 fragments (     1 KB)
 800 B,       2 allocated (     1 KB),      3 fragments (     2 KB)
 992 B,       3 allocated (     2 KB),      1 fragments (     0 KB)
 TOTAL,      61 allocated (    15 KB),    358 fragments (    50 KB)
Empty 4KB pages 0 (0 KB)
Large block count 9, total size 119 KB
Large fragments count 5, total size 71 KB
Huge block count 80, total size 1779376 KB
Sys block count 0, total size 0 KB
224MB master blocks 4

Large fragments:
1 KB: 1
8 KB: 1
17.25 KB: 1
22 KB: 1
23.5 KB: 1

Huge fragments:
8 KB: 1
16 KB: 1
20 KB: 3
32 KB: 5
36 KB: 2
40 KB: 1
44 KB: 1
52 KB: 1
64 KB: 20
68 KB: 1
80 KB: 6
92 KB: 2
120 KB: 1
128 KB: 1
144 KB: 1
156 KB: 1
164 KB: 1
180 KB: 2
188 KB: 2
192 KB: 3
196 KB: 1
204 KB: 1
248 KB: 1
252 KB: 1
272 KB: 2
276 KB: 1
284 KB: 1
288 KB: 1
296 KB: 2
304 KB: 1
320 KB: 1
328 KB: 1
348 KB: 1
364 KB: 1
384 KB: 1
396 KB: 2
412 KB: 1
440 KB: 1
464 KB: 1
468 KB: 1
484 KB: 1
500 KB: 1
504 KB: 1
512 KB: 1
520 KB: 1
560 KB: 2
564 KB: 1
568 KB: 1
576 KB: 1
580 KB: 1
612 KB: 1
616 KB: 1
620 KB: 1
640 KB: 1
652 KB: 2
696 KB: 1
700 KB: 1
708 KB: 1
740 KB: 1
760 KB: 1
780 KB: 1
784 KB: 1
796 KB: 1
916 KB: 1
944 KB: 1
972 KB: 1
1044 KB: 1
1084 KB: 1
1088 KB: 1
1148 KB: 1
1184 KB: 1
1200 KB: 1
1212 KB: 1
1216 KB: 1
1272 KB: 1
1280 KB: 1
1300 KB: 1
1364 KB: 1
1464 KB: 1
1512 KB: 1
1616 KB: 1
1716 KB: 1
1720 KB: 1
1920 KB: 1
1996 KB: 1
2220 KB: 1
2280 KB: 1
2552 KB: 1
2576 KB: 1
2596 KB: 1
2804 KB: 1
2864 KB: 1
3080 KB: 1
3324 KB: 1
3420 KB: 1
3516 KB: 3
3580 KB: 6
3596 KB: 1
3644 KB: 1
3648 KB: 1
3916 KB: 1
4408 KB: 1
4452 KB: 1
4720 KB: 1
5564 KB: 1
5632 KB: 1
6996 KB: 1
7036 KB: 1
7100 KB: 1
7280 KB: 2
7632 KB: 1
7848 KB: 1
7864 KB: 1
8344 KB: 1
8448 KB: 1
8632 KB: 1
8820 KB: 1
8968 KB: 1
9124 KB: 1
9296 KB: 1
9440 KB: 1
9880 KB: 1
10612 KB: 1
10768 KB: 1
11136 KB: 1
11188 KB: 1
11420 KB: 1
13572 KB: 1
14304 KB: 1
14988 KB: 1
15168 KB: 1
15576 KB: 1
15924 KB: 1
16040 KB: 1
18012 KB: 1
19204 KB: 1
20108 KB: 1
20396 KB: 1
55160 KB: 1
top is saying that app is using 855 Mb max ...
Regards,
Novo
|
|
|
|
|
|
|
|
|
|
|
|
| Re: Core 2019 [message #51856 is a reply to message #51855] |
Sun, 09 June 2019 23:11 |
|
mirek
Messages: 14291
Registered: November 2005
|
Ultimate Member |
|
|
Novo wrote on Sun, 09 June 2019 21:39mirek wrote on Sun, 09 June 2019 12:54Looking at peak profile, it looks like there are very little "small" blocks and most of memory is in those 80 "huge" (that means >64KB) blocks.
Can that be correct?
Mirek
It is hard to tell. I'm not controlling that.
Another problem is that all allocations/deallocations happen in CoWork's threads. I cannot call RDUMP(*PeakMemoryProfile()) inside of CoWork because it will be called at least 181363 times ...
Why would you want to? Peak is really peak, it is profile at the moment when there is maximum memory use.
One caveat about profile is that it is only profile of current thread for small and large blocks. But our problem is with huge blocks anyway.
Quote:
The app is parsing Wikipedia XML dump. It is decompressing a bz2 archive and parsing chunks of XML. After that my own parser is parsing Mediawiki text.
As a first pass my parser is building a list of tokens organized as a Vector<> (I'm not inserting in the middle )
My parser is avoiding memory allocation at all possible costs. I'm calling Vector::SetCountR and reusing these vectors. When I need to deal with String I'm using my own not owning data string class.
Well, maybe there can also be an interference with MemoryTryRealloc (as those Vectors grow). Perhaps you can test what happens if
bool  MemoryTryRealloc(void *ptr, size_t& newsize) {
	return false; // (((dword)(uintptr_t)ptr) & 16) && MemoryTryRealloc__(ptr, newsize);
}
Quote:
Unfortunately, I cannot control memory allocation with XmlParser. I have to relay on the default allocator.
There are not many... BTW, are you parsing memory - XmlParser(const char *), or streams - XmlParser(Stream& in) ?
Mirek
|
|
|
|
| Re: Core 2019 [message #51857 is a reply to message #51856] |
Sun, 09 June 2019 23:25 |
|
mirek
Messages: 14291
Registered: November 2005
|
Ultimate Member |
|
|
Here is the code for logging all huge allocations (replace in Core/hheap.cpp):
void *Heap::HugeAlloc(size_t count) // count in 4kb pages
{
	ASSERT(count);

#ifdef LSTAT
	if(count < 65536)
		hstat[count]++;
#endif

	huge_4KB_count += count;

	if(huge_4KB_count > huge_4KB_count_max) {
		huge_4KB_count_max = huge_4KB_count;
		if(MemoryUsedKb() > sKBLimit)
			Panic("MemoryLimitKb breached!");
		if(sPeak)
			Make(*sPeak);
	}

	if(!D::freelist[0]->next) { // initialization
		for(int i = 0; i < 2; i++)
			Dbl_Self(D::freelist[i]);
	}

	if(count > HPAGE) { // we are wasting 4KB to store just 4 bytes here, but this is >32MB after all..
		LTIMING("SysAlloc");
		byte *sysblk = (byte *)SysAllocRaw((count + 1) * 4096, 0);
		BlkHeader *h = (BlkHeader *)(sysblk + 4096);
		h->size = 0;
		*((size_t *)sysblk) = count;
		sys_count++;
		sys_size += 4096 * count;
		return h;
	}

	LTIMING("Huge Alloc");

	word wcount = (word)count;

	if(16 * free_4KB > huge_4KB_count) // keep number of free 4KB blocks in check
		FreeSmallEmpty(INT_MAX, int(free_4KB - huge_4KB_count / 32));

	for(int pass = 0; pass < 2; pass++) {
		for(int i = count >= 16; i < 2; i++) {
			BlkHeader *l = D::freelist[i];
			BlkHeader *h = l->next;
			while(h != l) {
				word sz = h->GetSize();
				if(sz >= count) {
					void *ptr = MakeAlloc(h, wcount);
					if(count > 16)
						RLOG("HugeAlloc " << asString(ptr) << ", size: " << asString(count));
					return ptr;
				}
				h = h->next;
			}
		}

		if(!FreeSmallEmpty(wcount, INT_MAX)) { // try to coalesce 4KB small free blocks back to huge storage
			void *ptr = SysAllocRaw(HPAGE * 4096, 0);
			HugePage *pg = (HugePage *)MemoryAllocPermanent(sizeof(HugePage));
			pg->page = ptr;
			pg->next = huge_pages;
			huge_pages = pg;
			AddChunk((BlkHeader *)ptr, HPAGE); // failed, add 32MB from the system
			huge_chunks++;
		}
	}
	Panic("Out of memory");
	return NULL;
}

int Heap::HugeFree(void *ptr)
{
	BlkHeader *h = (BlkHeader *)ptr;
	if(h->size == 0) {
		LTIMING("Sys Free");
		byte *sysblk = (byte *)h - 4096;
		size_t count = *((size_t *)sysblk);
		SysFreeRaw(sysblk, (count + 1) * 4096);
		huge_4KB_count -= count;
		sys_count--;
		sys_size -= 4096 * count;
		return 0;
	}
	LTIMING("Huge Free");
	if(h->GetSize() > 16)
		RLOG("HugeFree " << asString(ptr) << ", size: " << asString(h->GetSize()));
	huge_4KB_count -= h->GetSize();
	return BlkHeap::Free(h)->GetSize();
}

bool Heap::HugeTryRealloc(void *ptr, size_t count)
{
	bool b = count <= HPAGE && BlkHeap::TryRealloc(ptr, count, huge_4KB_count);
	if(b)
		RLOG("HugeRealloc " << asString(ptr) << ", size: " << asString(count));
	return b;
}
(please test with active MemoryTryRealloc)
[Updated on: Sun, 09 June 2019 23:25] Report message to a moderator |
|
|
|
|
|
| Re: Core 2019 [message #51862 is a reply to message #51860] |
Mon, 10 June 2019 18:01 |
Novo
Messages: 1433
Registered: December 2006
|
Ultimate Contributor |
|
|
mirek wrote on Mon, 10 June 2019 11:27I have tried to improve fragmentation using approximate best fit, hopefully this will help a bit... (in trunk)
Thanks!
mem: 400 Mb, time: 230 s.
This is a huge improvement.
Regards,
Novo
|
|
|
|
|
|
| Re: Core 2019 [message #51864 is a reply to message #51856] |
Mon, 10 June 2019 18:18 |
Novo
Messages: 1433
Registered: December 2006
|
Ultimate Contributor |
|
|
mirek wrote on Sun, 09 June 2019 17:11BTW, are you parsing memory - XmlParser(const char *), or streams - XmlParser(Stream& in) ?
Stream. bz2::DecompressStream.
I guess that XmlParser is responsible for fragmentation.
Regards,
Novo
|
|
|
|
| Re: Core 2019 [message #51865 is a reply to message #51863] |
Mon, 10 June 2019 18:21 |
Novo
Messages: 1433
Registered: December 2006
|
Ultimate Contributor |
|
|
mirek wrote on Mon, 10 June 2019 12:17
Cool. So I guess issue solved and we do not need to worry about other tests?
I'll try to run other tests and see what happens ...
Regards,
Novo
|
|
|
|
| Re: Core 2019 [message #51866 is a reply to message #51856] |
Mon, 10 June 2019 18:34 |
Novo
Messages: 1433
Registered: December 2006
|
Ultimate Contributor |
|
|
mirek wrote on Sun, 09 June 2019 17:11
Well, maybe there can also be an interference with MemoryTryRealloc (as those Vectors grow). Perhaps you can test what happens if
bool  MemoryTryRealloc(void *ptr, size_t& newsize) {
	return false; // (((dword)(uintptr_t)ptr) & 16) && MemoryTryRealloc__(ptr, newsize);
}
This doesn't affect anything.
Regards,
Novo
|
|
|
|
| Re: Core 2019 [message #51867 is a reply to message #51857] |
Mon, 10 June 2019 18:45 |
Novo
Messages: 1433
Registered: December 2006
|
Ultimate Contributor |
|
|
mirek wrote on Sun, 09 June 2019 17:25Here is the code for logging all huge allocations (replace in Core/hheap.cpp):
This code is crashing with the latest trunk.
I guess we can stop at this point.
Regards,
Novo
|
|
|
|
| Re: Core 2019 [message #51923 is a reply to message #51812] |
Fri, 21 June 2019 05:43 |
Novo
Messages: 1433
Registered: December 2006
|
Ultimate Contributor |
|
|
Update.
I changed my app. Now it is doing a bunch of string manipulations (mostly concatenations)
Results:
U++:
time: 234s, mem is growing to 4.4Gb and it is not going down till the very end.
glibc:
Default settings (8-core CPU, CoWork pool has 18 threads):
time: 239s, mem max is 6.5Gb down to 3.6Gb
export MALLOC_ARENA_MAX=16
time: 239s, mem max is 4.2Gb down to 2.8Gb
export MALLOC_ARENA_MAX=8
time: 244s, mem max is 4.0Gb down to 1.3Gb
Conclusion:
glibc allocator is more efficient with a little bit of manual tuning. Difference in performance is not that signifficant. Cannot tell anything about Windows.
Regards,
Novo
[Updated on: Sat, 22 June 2019 18:08] Report message to a moderator |
|
|
|
| Re: Core 2019 [message #51924 is a reply to message #51923] |
Fri, 21 June 2019 06:14 |
Novo
Messages: 1433
Registered: December 2006
|
Ultimate Contributor |
|
|
It looks like performance of the glibc allocator depends on a state of the system. Got new interesting results:
export MALLOC_ARENA_MAX=20
time: 239s, mem max is 3.9Gb down to 0.7Gb
Regards,
Novo
|
|
|
|
| Re: Core 2019 [message #51925 is a reply to message #51924] |
Fri, 21 June 2019 09:16 |
|
mirek
Messages: 14291
Registered: November 2005
|
Ultimate Member |
|
|
I think you cannot deduce too much about efficiency looking at "down" number. That will depend a lot on overall load of system, more the load, less this number as system will page out unused pages from your apps address space. So the current philosophy of U++ allocator is that this does not matter.
Further explanation. The function that any allocator is using to obtain address space from system is mmap and there is munmap that returns address space to system. Normally there is a threshold - if block is too big, it allocation is simply handled by mmap / munmap calls, meaning it is returned to the system at MemoryFree. If it is less than threshold, bigger chung is mmaped from the system and then divided to smaller chunks (somehow).
Now what is different is that standard GCC allocator has thershold at 4MB. U++ allocatar at 224MB. In practive, this means that if you alloc / free 5MB block in std, it gets released back to system immediately. With U++, blocks up to 224 MB are not returned to the system immediately. If they are really unused, this just means that system will retrieve them when there is a need for more physical memory.
Mirek
|
|
|
|
|
|
| Re: Core 2019 [message #51931 is a reply to message #51925] |
Fri, 21 June 2019 17:59 |
Novo
Messages: 1433
Registered: December 2006
|
Ultimate Contributor |
|
|
mirek wrote on Fri, 21 June 2019 03:16
Now what is different is that standard GCC allocator has thershold at 4MB. U++ allocatar at 224MB. In practive, this means that if you alloc / free 5MB block in std, it gets released back to system immediately. With U++, blocks up to 224 MB are not returned to the system immediately. If they are really unused, this just means that system will retrieve them when there is a need for more physical memory.
Mirek
This info doesn't match what I'm reading in the docs I posted above.
              The lower limit for this parameter is 0.  The upper limit is
              DEFAULT_MMAP_THRESHOLD_MAX: 512*1024 on 32-bit systems or
              4*1024*1024*sizeof(long) on 64-bit systems.

              Note: Nowadays, glibc uses a dynamic mmap threshold by
              default.  The initial value of the threshold is 128*1024, but
              when blocks larger than the current threshold and less than or
              equal to DEFAULT_MMAP_THRESHOLD_MAX are freed, the threshold
              is adjusted upward to the size of the freed block.  When
              dynamic mmap thresholding is in effect, the threshold for
              trimming the heap is also dynamically adjusted to be twice the
              dynamic mmap threshold.  Dynamic adjustment of the mmap
              threshold is disabled if any of the M_TRIM_THRESHOLD,
              M_TOP_PAD, M_MMAP_THRESHOLD, or M_MMAP_MAX parameters is set.
So, the old allocator on 64-bit systems had threshold 32Mb (4*1024*1024*sizeof(long)).
In the new one it is determined dynamically. Initial value is 128Kb.
I traced my app with a tool which intercepts all malloc/free calls. I know exactly what is stressing the allocator 
Memory block sizes:
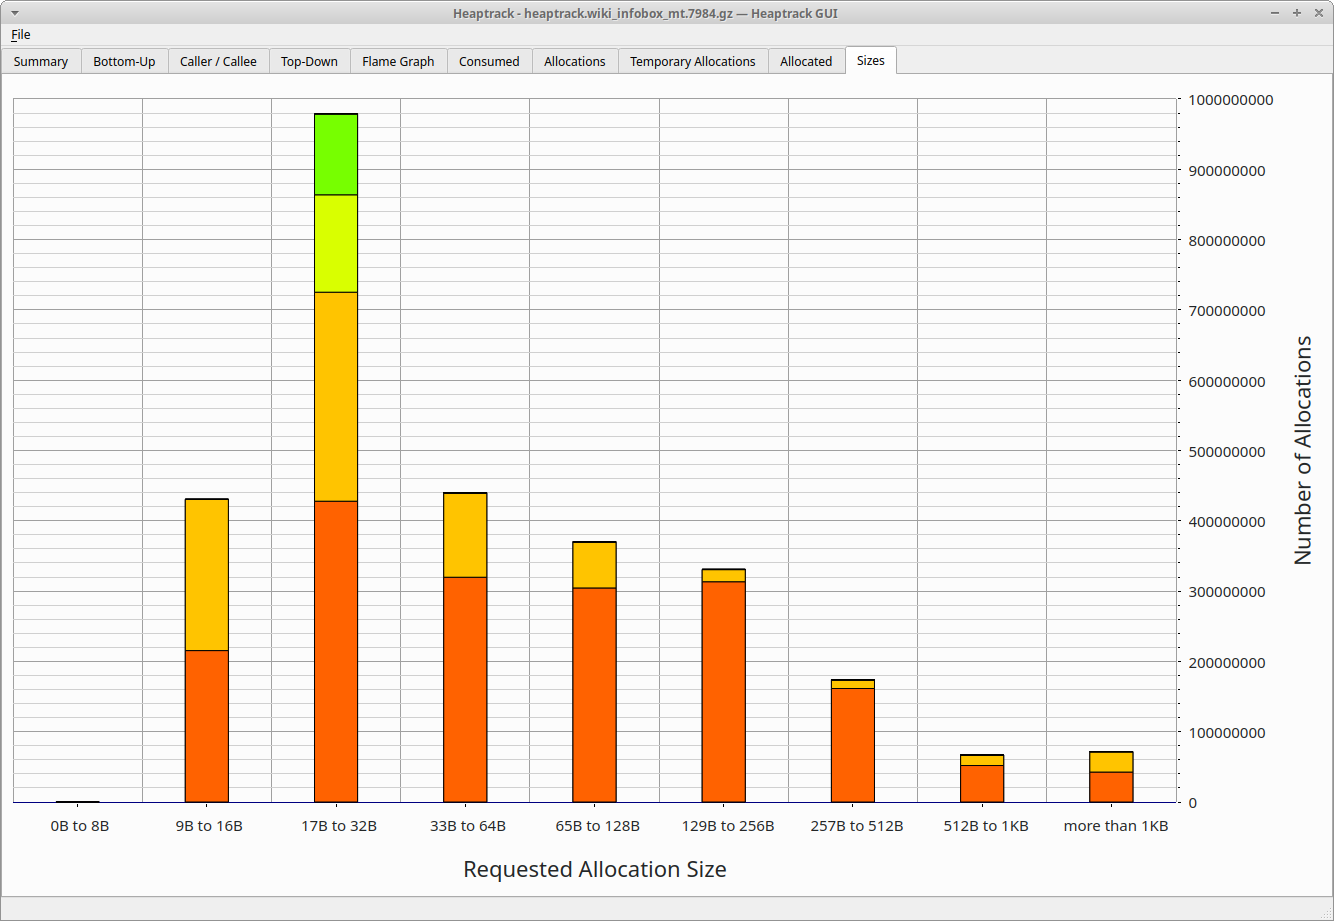
Regards,
Novo
|
|
|
|
|
|
| Re: Core 2019 [message #51933 is a reply to message #51932] |
Fri, 21 June 2019 18:10 |
Novo
Messages: 1433
Registered: December 2006
|
Ultimate Contributor |
|
|
Unfortunately, I couldn't find a decent tool to track real amount of system memory (mmaped) used by an app.
A chart similar to one above would be very helpful, otherwise I can just compare most notable values.
Regards,
Novo
|
|
|
|
Goto Forum:
Current Time: Tue Aug 04 19:08:04 GMT+2 2026
Total time taken to generate the page: 0.01865 seconds
|
 U++ framework
 Search
 Help
Help Members
 Register
 Login
Login Home
Home