Home » Community » Newbie corner » How do I make this graph?
| Re: How do I make this graph? [message #39835 is a reply to message #39829] |
Sun, 05 May 2013 15:57   |
 |
 koldo
koldo
Messages: 3458
Registered: August 2008
|
Senior Veteran |
|
|
Hello Jerson
I imagine the X and Y axis are rather "custom" so I propose you this to have exactly what you want:
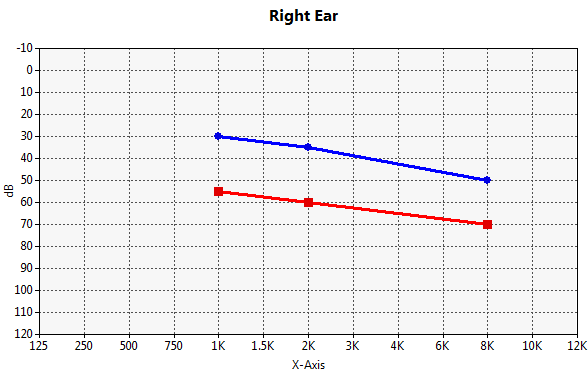
This is the code:
void MyClass::Init() {
	CtrlLayout(*this);
	HSizePos().VSizePos();

	scatter.SetRange(12, 130);
	scatter.SetXYMin(0, -120);
	scatter.SetMajorUnits(1, 10);
	scatter.ShowLegend(false);
	scatter.SetTitle("Right Ear").SetLabelX("X-Axis").SetLabelY("dB");
	scatter.SetPlotAreaLeftMargin(40).SetPlotAreaBottomMargin(40);

	s1 <<Pointf(4, -30) << Pointf(6, -35) << Pointf(10, -50);
	s2 <<Pointf(4, -55) << Pointf(6, -60) << Pointf(10, -70);

	scatter.AddSeries(s1);
	scatter.AddSeries(s2);

	scatter.cbModifFormatX = THISBACK(FormatX);
	scatter.cbModifFormatY = THISBACK(FormatY);
}

void MyClass::FormatX(String& s, int i, double d) {
	Vector<String> xLegend;
	xLegend << "125" << "250" << "500" << "750" << "1K" << "1.5K" << "2K" << "3K" << "4K" << "6K" << "8K" << "10K" << "12K";
	s = xLegend[i];
}

void MyClass::FormatY(String& s, int i, double d) {
	s = FormatDouble(-d, 0);
}
Have a nice Sunday! 
-
 Attachment: Image.png
(Size: 10.50KB, Downloaded 831 times)
Best regards
Iñaki
|
|
|
|
 |
|
How do I make this graph?
By: jerson on Sat, 04 May 2013 09:51 |
|
|
Re: How do I make this graph?
By: Didier on Sat, 04 May 2013 15:22 |
|
|
Re: How do I make this graph?
By: Didier on Sat, 04 May 2013 15:26 |
|
|
Re: How do I make this graph?
By: jerson on Sat, 04 May 2013 16:53 |
|
|
Re: How do I make this graph?
By: koldo on Sun, 05 May 2013 15:57 |
|
|
Re: How do I make this graph?
By: jerson on Sun, 05 May 2013 17:07 |
|
|
Re: How do I make this graph?
By: jerson on Sun, 05 May 2013 18:42 |
|
|
Re: How do I make this graph?
By: koldo on Sun, 05 May 2013 19:02 |
|
|
Re: How do I make this graph?
By: jerson on Mon, 06 May 2013 09:32 |
|
|
Re: How do I make this graph?
By: koldo on Mon, 06 May 2013 10:11 |
|
|
Re: How do I make this graph?
By: jerson on Mon, 06 May 2013 11:40 |
|
|
Re: How do I make this graph?
By: koldo on Mon, 06 May 2013 12:07 |
|
|
Re: How do I make this graph?
By: jerson on Thu, 09 May 2013 08:19 |
|
|
Re: How do I make this graph?
By: koldo on Thu, 09 May 2013 11:04 |
|
|
Re: How do I make this graph?
By: jerson on Thu, 09 May 2013 12:15 |
|
|
Re: How do I make this graph?
By: jerson on Thu, 09 May 2013 14:07 |
|
|
Re: How do I make this graph?
By: koldo on Thu, 09 May 2013 14:36 |
|
|
Re: How do I make this graph?
By: jerson on Thu, 09 May 2013 15:46 |
|
|
Re: How do I make this graph?
By: koldo on Thu, 09 May 2013 16:03 |
|
|
Re: How do I make this graph?
By: jerson on Fri, 10 May 2013 06:48 |
|
|
Re: How do I make this graph?
By: koldo on Fri, 10 May 2013 08:01 |
Goto Forum:
Current Time: Fri Apr 24 23:33:47 GMT+2 2026
Total time taken to generate the page: 0.00549 seconds
|
 U++ framework


