Home » U++ Library support » ScatterDraw & ScatterCtrl » Entirely Null series is drawn as a random constant line
| Re: Entirely Null series is drawn as a random constant line [message #56125 is a reply to message #56108] |
Fri, 29 January 2021 13:53   |
 Maginor
Messages: 44
Registered: May 2019
|
Member |
|
|
That particular problem seems to have been fixed, but I have a new one:
When I draw lines and there are holes (Nulls) in the series, the holes are now filled with a line. I rely on the behaviour that this had before, where no lines are drawn between two values if there is a Null in between.
It also gets weirder, because if there is a hole at some point, values at later points where there are no holes sometimes also get janky.
I think this problem was not introduced now, but earlier last year (I have not updated upp since maybe January 2019) because another person who attempted to build my application with the upp distribution from some time in the autumn of 2020 reported this problem.
Examples:
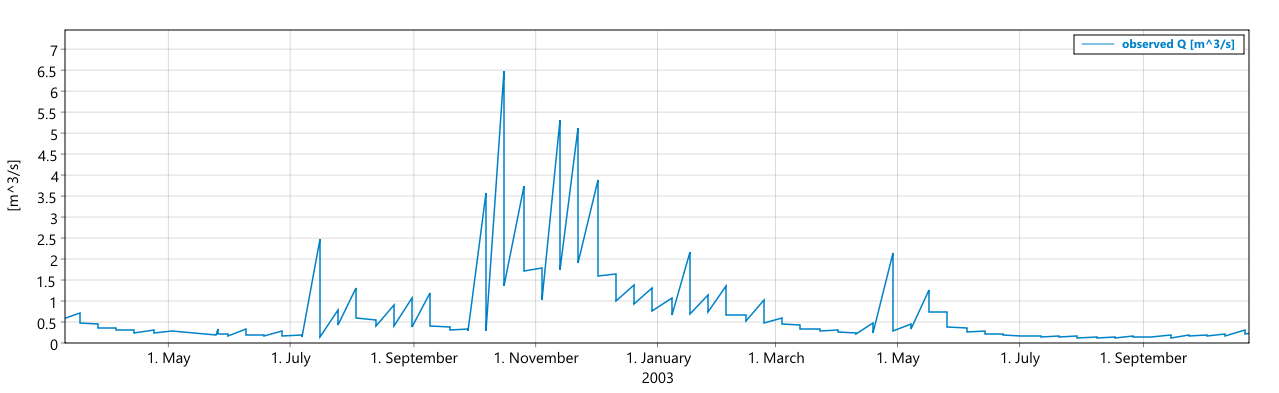
Correct behaviour from the old version:
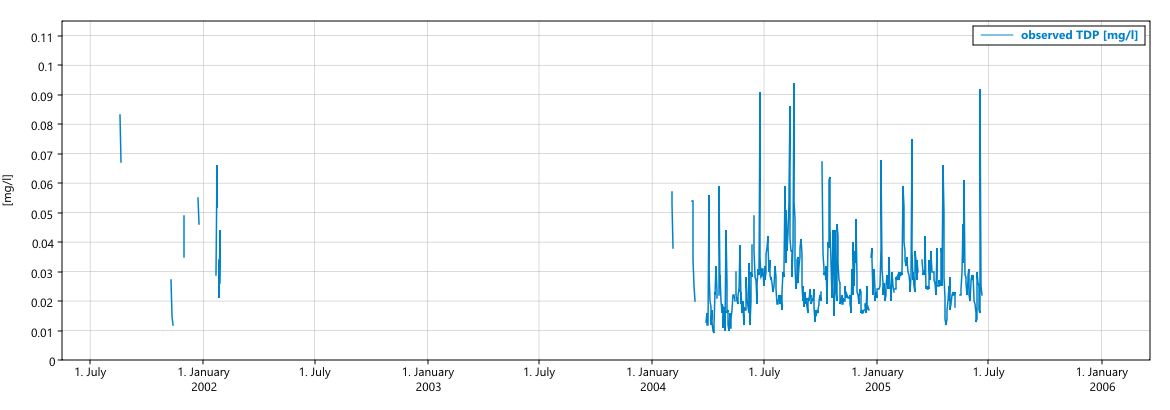
New behaviour on the same time series as above:
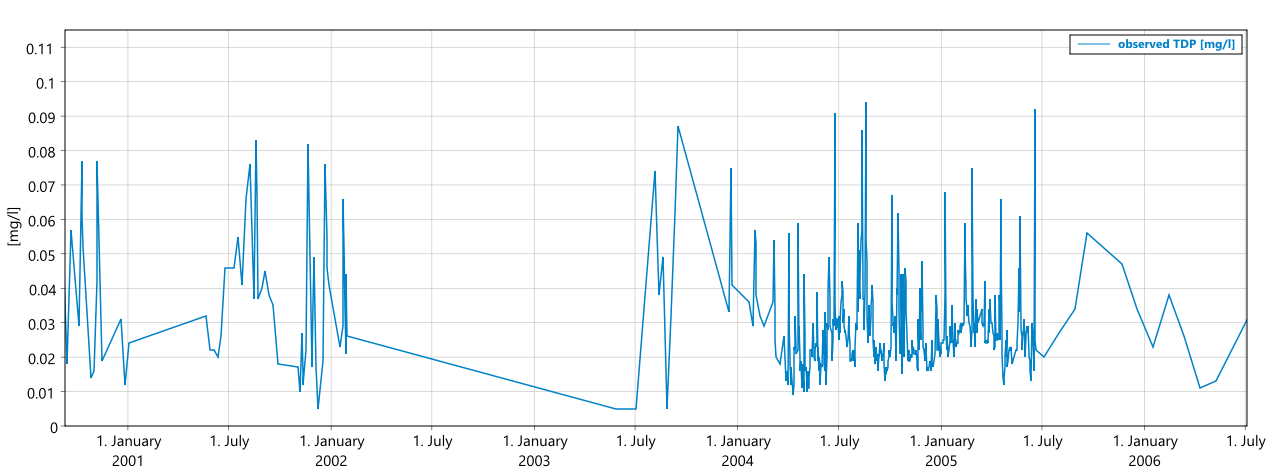
Correct behaviour from the old version:
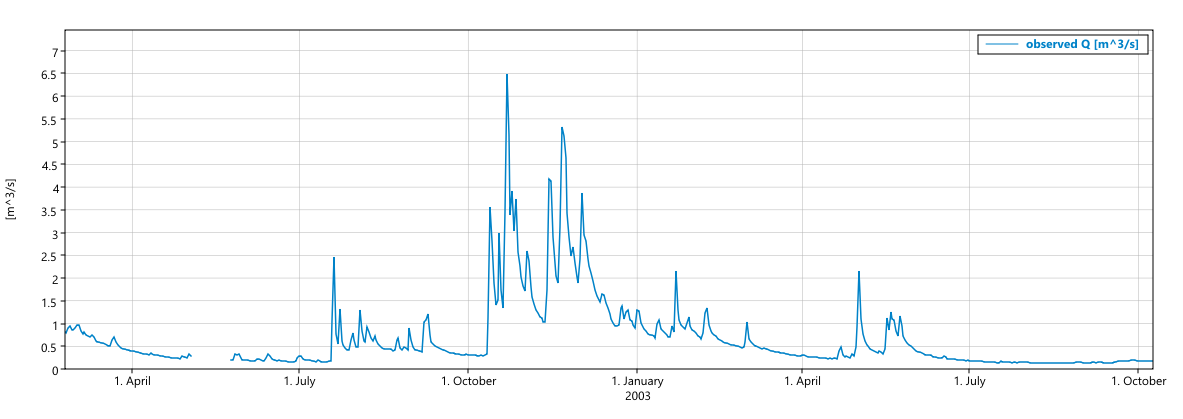
New behaviour on the same time series as above:
Edit:
I right clicked and looked at Scatter Data to confirm that the actual background data is the same in both versions, so the problem is with the plotting.
Edit:
I don't really understand the jankyness that is displayed in the second example. It may not be related to the hole issue at all. It seems like it begins happening at a random point in the time series. Some times that is at the beginning of the time series, other times it starts in the middle somewhere. However it seems like that if two series have the same set of X values, the jankiness tends to begin at the same X value for both.
What I call the "jankyness" here is that it puts two y values for each X value (which is not how the data are), and it skips points in between.
Note that I use pretty high X values (they are number of seconds since a reference date, and the series can go over many years). So if values are somehow rounded to float or something like that, maybe that could be an issue, but that is just random guessing.
These are all added using
AddSeries(double *, double *, int);
Note that I use
SetFastViewX(true);
SetSequentialXAll(true);
[Updated on: Fri, 29 January 2021 15:18] Report message to a moderator |
|
|
|
 |
|
Entirely Null series is drawn as a random constant line
By: Maginor on Wed, 27 January 2021 14:12 |
|
|
Re: Entirely Null series is drawn as a random constant line
By: koldo on Thu, 28 January 2021 09:23 |
|
|
Re: Entirely Null series is drawn as a random constant line
By: Maginor on Fri, 29 January 2021 13:53 |
|
|
Re: Entirely Null series is drawn as a random constant line
By: koldo on Sun, 31 January 2021 09:52 |
|
|
Re: Entirely Null series is drawn as a random constant line
By: Maginor on Sun, 31 January 2021 14:37 |
|
|
Re: Entirely Null series is drawn as a random constant line
By: koldo on Mon, 01 February 2021 11:21 |
|
|
Re: Entirely Null series is drawn as a random constant line
By: Maginor on Tue, 02 February 2021 10:29 |
|
|
Re: Entirely Null series is drawn as a random constant line
By: koldo on Tue, 02 February 2021 18:15 |
|
|
Re: Entirely Null series is drawn as a random constant line
By: koldo on Tue, 02 February 2021 19:12 |
|
|
Re: Entirely Null series is drawn as a random constant line
By: Maginor on Wed, 03 February 2021 11:02 |
|
|
Re: Entirely Null series is drawn as a random constant line
By: koldo on Wed, 03 February 2021 12:41 |
|
|
Re: Entirely Null series is drawn as a random constant line
By: Maginor on Mon, 15 February 2021 10:10 |
|
|
Re: Entirely Null series is drawn as a random constant line
By: koldo on Mon, 15 February 2021 18:04 |
Goto Forum:
Current Time: Sat Apr 20 10:26:45 CEST 2024
Total time taken to generate the page: 0.05067 seconds
|


 Members
 Pages
Pages Help
Help Register
 Login
Login Home
Home


")
