GeoFun
Spirograph Plotting
Description
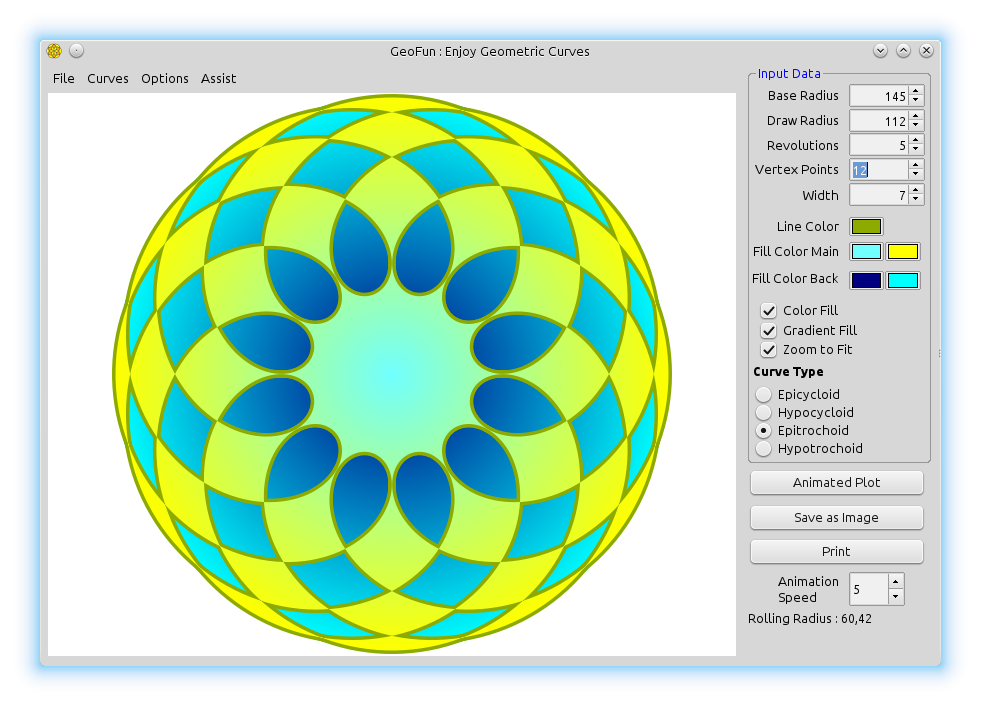
Application that main goal is to provide GUI interface for exploring "Sprirographs".
More information about Spriographs can be found on Wikipedia.
Result
GeoFun.h
#ifndef _GeoFun_GeoFun_h
#define _GeoFun_GeoFun_h
#include <CtrlLib/CtrlLib.h>
#include <Painter/Painter.h>
#include <plugin/jpg/jpg.h>
#include <Report/Report.h>
#include <RichText/RichText.h>
using namespace Upp;
#define IMAGECLASS GFImg
#define IMAGEFILE <GeoFun/GeoFun.iml>
#include <Draw/iml_header.h>
#define LAYOUTFILE <GeoFun/GeoFun.lay>
#include <CtrlCore/lay.h>
#define TOPICFILE <GeoFun/app.tpp/all.i>
#include <Core/topic_group.h>
bool cfgAvailable ;
class DrawCanvas : public ParentCtrl {
typedef DrawCanvas CLASSNAME ;
public:
virtual void Paint ( Draw& drw );
DrawCanvas();
template<class T>
void DoPaint0 ( T& sw, int idraw = 0 );
void DoPaint ( Painter& sw );
struct ColorPolygon : Moveable<ColorPolygon> {
Vector<Pointf> point;
Vector<Pointf> CenR;
Color lcolor;
Color fcolorM1, fcolorM2;
int penwidth;
bool filled ;
};
Vector<ColorPolygon> data;
Color fcolorB1, fcolorB2;
bool ShowGradient, ColorFill, Zoomed, ShowAnimation;
double Radius1, BaseR, RollR;
int ShowTo, AnimSpeed ;
};
class GeoFun : public WithGeoFunLayout<TopWindow> {
public:
typedef GeoFun CLASSNAME;
GeoFun();
double ArmLen;
DrawCanvas dc1;
WithInputLayout<ParentCtrl> InputPane ;
Splitter sp1;
QtfRichObject qtfim;
int ValP, ValQ, PenW, CurvT, GradientY;
Color PenC, M1C, M2C, B1C, B2C;
bool First ;
bool EpiCyclo , HypoCyclo, EpiTroch, HypoTroch, AnimMn;
// Functions
void About();
void Exit();
void FirstDraw();
Image GetImage();
void Help();
virtual void Layout();
void OptionColorFill();
void OptionGradient();
void OptionZoom();
void PrepareData();
void PrepareData0();
void Print();
void SaveToImageFile ( String fileName );
void SaveToAutoCadScript ( String fileName );
void SaveToSVG ( String fileName );
void SetAnimation();
void SetAnimationSpeed();
void SetCurveType ( int CrvType );
void SetCurveTypeMenu1 ( );
void SetCurveTypeMenu ( int CrvType );
void Serialize ( Stream& s );
void ShowAnimated();
// Menu Functions
void MainMenu ( Bar& menu );
void CurvesMenu ( Bar& bar );
void FileMenu ( Bar& bar );
void HelpMenu ( Bar& bar );
void SettingsMenu ( Bar& bar );
};
#endif
GeoFun.cpp
#include "GeoFun.h"
#define IMAGECLASS GFImg
#define IMAGEFILE <GeoFun/GeoFun.iml>
#include <Draw/iml_source.h>
//When idraw = 1 it will create image at actual size based on radius values
//Else image created to screen window diaplay size
template <class T>
void DrawCanvas::DoPaint0 ( T& sw, int idraw )
{
double x1, y1;
int cnt1, cnt2;
int RunTo ;
Sizef sz;
if ( idraw == 1 )
{
sz = Sizef ( 2 * Radius1 + 20, 2 * Radius1 + 20 );
}
else
{
sz = GetSize();
}
sw.Clear ( White() );
x1 = sz.cx / 2 ;
y1 = sz.cy / 2 ;
// Show color fill. Draw bacground circle with color
if ( ColorFill )
{
if ( ShowGradient )
{
sw.Ellipse ( x1, y1, Radius1, Radius1 ).Fill ( x1, y1, fcolorB1, Radius1, fcolorB2 );
}
else
{
sw.Ellipse ( x1, y1, Radius1, Radius1 ).Fill ( fcolorB1 );
}
}
cnt1 = data.GetCount();
for ( int i = 0; i < data.GetCount(); i++ )
{
Vector<Pointf>& p = data[i].point;
sw.Move ( x1 + p[0].x, y1 + p[0].y );
cnt2 = p.GetCount();
// If animation flag set do incremental display of curve
// elase show all curve points.
if ( ShowAnimation )
{
RunTo = ShowTo ;
}
else
{
RunTo = cnt2 ;
}
if ( RunTo > cnt2 ) RunTo = cnt2 ;
for ( int j = 1; j < RunTo; j++ )
sw.Line ( x1 + p[j].x, y1 + p[j].y );
sw.Stroke ( data[i].penwidth, data[i].lcolor );
sw.EvenOdd ( true );
if ( ColorFill )
{
if ( ShowGradient )
{
sw.Fill ( x1, y1, data[i].fcolorM1, Radius1, data[i].fcolorM2, GRADIENT_REFLECT );
}
else
{
sw.Fill ( data[i].fcolorM1 );
}
}
// Show if option animation set
if ( ShowAnimation )
{
sw.BeginOnPath ( 1.0 );
sw.DrawImage ( 0, -GFImg::Bee().GetHeight() / 2, GFImg::Bee() );
sw.End();
sw.Ellipse ( x1, y1, BaseR, BaseR ).Stroke ( 3, Blue() );
sw.Ellipse ( x1 + data[i].CenR[RunTo-2].x, y1 + data[i].CenR[RunTo-2].y, RollR, RollR ).Stroke ( 3, LtBlue() );
sw.Move ( x1, y1 );
sw.Line ( x1 + data[i].CenR[RunTo-2].x, y1 + data[i].CenR[RunTo-2].y );
sw.Line ( x1 + data[i].point[RunTo-2].x, y1 + data[i].point[RunTo-2].y );
sw.Stroke ( 3, Red() );
ColorFill = false ; // this is required to stop colorfill if other options are changed during animation
}
}
}
DrawCanvas::DrawCanvas()
{
}
// at present this function is redundant but kept here to improve printing in future
void DrawCanvas::DoPaint ( Painter& sw )
{
bool painting = false ;
if ( painting )
{
PaintingPainter h ( 4000, 4000 );
DoPaint0 ( h, 0 );
sw.Paint ( h );
}
else
DoPaint0 ( sw, 0 );
}
void DrawCanvas::Paint ( Draw& drw )
{
Size sz = GetSize();
ImageBuffer ib ( sz );
BufferPainter sw ( ib );
bool transparent = false ;
DoPaint ( sw );
drw.DrawImage ( 0, 0, ib );
}
Image GeoFun::GetImage()
{
Size sz = Size (int( dc1.Radius1 * 2 + 20 ), int( dc1.Radius1 * 2 + 20 ) );
ImageBuffer ib ( sz );
BufferPainter bp ( ib, MODE_ANTIALIASED );
dc1.DoPaint0 ( bp, 1 );
return ib;
}
void GeoFun::SaveToImageFile ( String fileName )
{
GuiLock __;
if ( IsNull ( fileName ) )
{
FileSel fs;
fs.Type ( "PNG file", "*.png" );
fs.Type ( "JPEG file", "*.jpg" );
if ( !fs.ExecuteSaveAs ( t_ ( "Saving plot to PNG or JPEG file" ) ) )
{
Exclamation ( t_ ( "Plot has not been saved" ) );
return;
}
fileName = fs;
}
if ( GetFileExt ( fileName ) == ".png" )
{
PNGEncoder encoder;
encoder.SaveFile ( fileName, GetImage() );
}
else
if ( GetFileExt ( fileName ) == ".jpg" )
{
JPGEncoder encoder ( 90 );
encoder.SaveFile ( fileName, GetImage() );
}
else
Exclamation ( Format ( t_ ( "File format \"%s\" not found" ), GetFileExt ( fileName ) ) );
}
void GeoFun::SaveToAutoCadScript ( String fileName )
{
if ( IsNull ( fileName ) )
{
FileSel fs;
fs.Type ( "SCR file", "*.scr" );
if ( !fs.ExecuteSaveAs ( t_ ( "Saving plot to Polyline -- AutoCAD Script " ) ) )
{
Exclamation ( t_ ( "Plot has not been saved" ) );
return;
}
fileName = fs;
}
if ( GetFileExt ( fileName ) == ".scr" )
{
String sScr ;
for ( int i = 0; i < dc1.data.GetCount(); i++ )
{
sScr << "PLINE\n" ;
Vector<Pointf>& p = dc1.data[i].point;
for ( int j = 0; j < p.GetCount(); j++ )
sScr << p[j].x << "," << p[j].y << "\n";
sScr << "\nZ\nE\n";
}
FileOut fo ;
fo.Open ( fileName );
fo.Put ( sScr );
fo.Close();
}
}
void GeoFun::SaveToSVG ( String fileName )
{
if ( IsNull ( fileName ) )
{
FileSel fs;
fs.Type ( "SVG file", "*.svg" );
if ( !fs.ExecuteSaveAs ( t_ ( "Saving as SVG file " ) ) )
{
Exclamation ( t_ ( "SVG has not been saved" ) );
return;
}
fileName = fs;
}
if ( GetFileExt ( fileName ) == ".svg" )
{
String sXML ;
sXML.Clear();
sXML << "<?xml version=\"1.0\" standalone=\"no\"?>" ;
sXML << "<!DOCTYPE svg PUBLIC \"-//W3C//DTD SVG 1.1//EN\" " ;
sXML << "\"http://www.w3.org/Graphics/SVG/1.1/DTD/svg11.dtd\">" ;
sXML << "<svg width=\"100%\" height=\"100%\" version=\"1.1\" " ;
sXML << "xmlns=\"http://www.w3.org/2000/svg\"> \n \n" ;
for ( int i = 0; i < dc1.data.GetCount(); i++ )
{
sXML << "\n<polygon points=\" ";
Vector<Pointf>& p = dc1.data[i].point;
for ( int j = 0; j < p.GetCount(); j++ )
sXML << Format ( "%0.4f", p[j].x ) << "," << Format ( "%0.4f", p[j].y ) << " ";
sXML << "\" style=\"fill:none;stroke:#00C000;stroke-width:0.4\" />\n" ;
}
sXML << "</svg>\n";
FileOut fo ;
fo.Open ( fileName );
fo.Put ( sXML );
fo.Close();
}
}
void GeoFun::Print()
{
Report r;
String sQtf;
r.SetPageSize ( 4400, 4400 );
Size sz = Size ( 4200, 4200 );
Image im = GetImage();
qtfim = CreatePNGObject ( im, Size ( 600, 600 ), sz );
sQtf << "[s0;= " ;
sQtf << qtfim << " ]";
r << sQtf ;
Perform ( r );
}
// This function calculates curve data points for display
void GeoFun::PrepareData0()
{
int p, q, pw;
double a, b, h ;
double x, y;
double Period, step, t ;
static int prepd = 0;
step = 1.0 ; // value in deg
int q1 = InputPane.edValP ;
if ( q1 > 0 )
{
p = InputPane.edValP ;
}
else
{
p = 1 ;
InputPane.edValP.SetData ( p ) ;
}
q1 = InputPane.edValQ ;
if ( q1 > 0 )
{
q = InputPane.edValQ ;
}
else
{
q = 1 ;
InputPane.edValQ.SetData ( q ) ;
}
q1 = InputPane.edPenWidth ;
if ( q1 > 0 )
{
pw = InputPane.edPenWidth ;
}
else
{
pw = 1 ;
InputPane.edPenWidth.SetData ( pw ) ;
}
Period = 2 * M_PI * p ;
int iCrv = ~InputPane.CurveType;
if ( ( iCrv == 1 ) || ( iCrv == 3 ) )
{
p = -p ;
}
double tmp = InputPane.edBaseCircleRad;
if ( tmp < 10 )
{
a = 10 ;
InputPane.edBaseCircleRad.SetData ( a );
}
else
{
a = InputPane.edBaseCircleRad;
}
b = ( double ) p * a / ( double ) q;
dc1.BaseR = a ;
dc1.RollR = fabs ( b );
if ( iCrv < 2 )
{
h = fabs ( b );
}
else
{
tmp = InputPane.edArmLength ;
if ( tmp < 0 )
{
h = 0 ;
InputPane.edArmLength.SetData ( h ) ;
}
else
{
h = InputPane.edArmLength ;
}
}
dc1.Radius1 = fabs ( a + b ) + h ;
InputPane.RollingRad = "Rolling Radius : " + Format ( "%0.2f", b ) ;
// ShowAnimation = ~InputPane.optAnimate ;
dc1.Zoomed = InputPane.optZoom.GetData();
if ( dc1.Zoomed )
{
Size sz = dc1.GetSize();
double dmax = sz.cx ;
if ( sz.cy < dmax )
dmax = sz.cy;
dmax -= 10 ;
double zScale = fabs ( dmax / ( 2 * dc1.Radius1 ) );
a = a * zScale;
h = h * zScale;
b = b * zScale;
dc1.BaseR = a ;
dc1.RollR = fabs ( b );
dc1.Radius1 = fabs ( a + b ) + h ;
}
dc1.data.Clear();
dc1.data.Add();
dc1.data[0].point.Clear();
dc1.data[0].CenR.Clear();
dc1.data[0].lcolor = ~InputPane.LineColor;
dc1.data[0].fcolorM1 = ~InputPane.FillColorM1;
dc1.data[0].fcolorM2 = ~InputPane.FillColorM2;
dc1.data[0].penwidth = pw;
dc1.fcolorB1 = ~InputPane.FillColorB1;
dc1.fcolorB2 = ~InputPane.FillColorB2;
dc1.ShowGradient = ~InputPane.optGradient;
dc1.ColorFill = ~InputPane.optColorFill;
int NumSteps = abs ( ( int ) ( 2.0 * ( double ) p * 180.0 / step ) ) + 1 ;
for ( int i = 0; i < NumSteps; i++ )
{
t = ( double ) i / ( double ) NumSteps * Period ;
x = ( a + b ) * cos ( t ) + h * cos ( ( ( a + b ) / b ) * t ) ;
y = ( a + b ) * sin ( t ) + h * sin ( ( ( a + b ) / b ) * t );
Pointf p1;
p1.Clear();
p1.x = x ;
p1.y = y ;
dc1.data[0].point.Add ( p1 );
p1.Clear();
x = ( a + b ) * cos ( t );
y = ( a + b ) * sin ( t );
p1.x = x ;
p1.y = y ;
dc1.data[0].CenR.Add ( p1 );
}
Pointf p1;
p1.x = dc1.data[0].point[0].x ;
p1.y = dc1.data[0].point[0].y ;
dc1.data[0].point.Add ( p1 );
prepd++;
}
void GeoFun::PrepareData()
{
PrepareData0();
dc1.Refresh();
}
void GeoFun::ShowAnimated()
{
int MaxCnt = dc1.data[0].point.GetCount();
// static dword LastTickCount = GetTickCount() ;
if ( dc1.ShowAnimation )
{
if ( dc1.ShowTo < MaxCnt )
{
dc1.Refresh();
dc1.ShowTo += dc1.AnimSpeed ;
}
else
{
dc1.ShowAnimation = false ;
dc1.ColorFill = ~InputPane.optColorFill ;
dc1.Refresh();
}
}
// RLOG("TickCount - " <<( GetTickCount() - LastTickCount));
// LastTickCount = GetTickCount();
}
void GeoFun::SetAnimation()
{
dc1.AnimSpeed = InputPane.edAnimSpeed.GetData();
dc1.ShowTo = 5 ;
dc1.ShowAnimation = true ;
dc1.ColorFill = false ;
}
void GeoFun::FirstDraw()
{
First = false ;
PrepareData();
SetTimeCallback ( -30, THISBACK ( ShowAnimated ), 50 );
}
void GeoFun::Serialize ( Stream& s )
{
s
% InputPane.edArmLength
% InputPane.edBaseCircleRad
% InputPane.edPenWidth
% InputPane.edValP
% InputPane.edValQ
% InputPane.LineColor
% InputPane.FillColorM1
% InputPane.FillColorM2
% InputPane.FillColorB1
% InputPane.FillColorB2
% InputPane.optGradient
% InputPane.optColorFill
% InputPane.CurveType
% InputPane.optZoom
% InputPane.edAnimSpeed
;
SerializePlacement ( s );
}
// Using layout to redraw on windows resize
void GeoFun::Layout()
{
if ( !First )
{
PrepareData0();
}
TopWindow::Layout();
}
void GeoFun::About()
{
WithAboutLayout<TopWindow> dlg;
dlg.AboutText = GetTopic ( "topic://GeoFun/app/About$en-us" ).text;
CtrlLayoutOK ( dlg, "About" );
dlg.CenterScreen();
dlg.Run();
}
void GeoFun::Help()
{
HelpWindow helpme;
helpme.GoTo ( "topic://GeoFun/app/Help$en-us" );
helpme.Execute();
}
void GeoFun::Exit()
{
Close();
}
void GeoFun::SetAnimationSpeed()
{
dc1.AnimSpeed = InputPane.edAnimSpeed.GetData();
if ( dc1.AnimSpeed < 1 ) dc1.AnimSpeed = 1;
if ( dc1.AnimSpeed > 20 ) dc1.AnimSpeed = 20;
InputPane.edAnimSpeed.SetData ( dc1.AnimSpeed );
}
void GeoFun::OptionColorFill()
{
int i = InputPane.optColorFill.Get();
i = i ? 0 : 1;
InputPane.optColorFill.Set ( i ) ;
PrepareData();
}
void GeoFun::OptionGradient()
{
int i = InputPane.optGradient.Get();
i = i ? 0 : 1;
InputPane.optGradient.Set ( i ) ;
PrepareData();
}
void GeoFun::OptionZoom()
{
int i = InputPane.optZoom.Get();
i = i ? 0 : 1;
InputPane.optZoom.Set ( i ) ;
PrepareData();
}
void GeoFun::SetCurveType ( int CrvType )
{
InputPane.CurveType.SetData ( CrvType );
SetCurveTypeMenu ( CrvType );
}
void GeoFun::SetCurveTypeMenu1 ( )
{
int CrvType = InputPane.CurveType.GetData();
SetCurveTypeMenu ( CrvType );
}
void GeoFun::SetCurveTypeMenu ( int CrvType )
{
EpiCyclo = HypoCyclo = EpiTroch = HypoTroch = false ;
switch ( CrvType )
{
case 1 : HypoCyclo = true ; break ;
case 2 : EpiTroch = true ; break ;
case 3 : HypoTroch = true ; break ;
default : EpiCyclo = true ;
}
PrepareData();
}
// Menu Functions
void GeoFun::SettingsMenu ( Bar& bar )
{
bar.Add ( t_ ( "Color Fill" ), THISBACK ( OptionColorFill ) ).Check ( dc1.ColorFill )
.Help ( t_ ( "Change settings" ) );
bar.Add ( t_ ( "Gradient Fill" ), THISBACK ( OptionGradient ) ).Check ( dc1.ShowGradient )
.Help ( t_ ( "Change settings" ) );
bar.Add ( t_ ( "Zoom Fit" ), THISBACK ( OptionZoom ) ).Check ( dc1.Zoomed )
.Help ( t_ ( "Zoom fit to window area" ) );
}
void GeoFun::FileMenu ( Bar& bar )
{
bar.Add ( t_ ( "Save Image" ), CtrlImg::save_as(), THISBACK1 ( SaveToImageFile, "" ) )
.Help ( t_ ( "Save Image as PNG or JPG" ) );
bar.Add ( t_ ( "Save AutoCAD Script" ), CtrlImg::save(), THISBACK1 ( SaveToAutoCadScript, "" ) )
.Help ( t_ ( "Save as AutoCAD Script (.scr) file" ) );
bar.Add ( t_ ( "Save as SVG" ), CtrlImg::save(), THISBACK1 ( SaveToSVG, "" ) )
.Help ( t_ ( "Save as Scalable vector graphics (.svg) file" ) );
bar.Separator();
bar.Add ( t_ ( "Print" ), CtrlImg::print() , THISBACK ( Print ) )
.Help ( t_ ( "Print the image , will fit to A4 page" ) );
bar.Separator();
bar.Add ( t_ ( "Exit" ), THISBACK ( Exit ) )
.Help ( t_ ( "Exit the application" ) );
}
void GeoFun::CurvesMenu ( Bar& bar )
{
bar.Add ( t_ ( "Epicycloid" ), THISBACK1 ( SetCurveType, 0 ) )
.Help ( t_ ( "Plot Epicycloid curve" ) ).Check(EpiCyclo);
bar.Add ( t_ ( "Hypocycloid" ), THISBACK1 ( SetCurveType, 1 ) )
.Help ( t_ ( "Plot Hypocycloid curve" ) ).Check(HypoCyclo);
bar.Add ( t_ ( "Epitrochoid" ), THISBACK1 ( SetCurveType, 2 ) )
.Help ( t_ ( "Plot Epitrochoid curve" ) ).Check(EpiTroch);
bar.Add ( t_ ( "Hypotrochoid" ), THISBACK1 ( SetCurveType, 3 ) )
.Help ( t_ ( "Plot Hypotrochoid curve" ) ).Check(HypoTroch);
bar.Separator();
bar.Add ( t_ ( "Animated Plot" ), THISBACK ( SetAnimation ) )
.Help ( t_ ( "Show animation of the curve drawing" ) ).Check(AnimMn);
}
void GeoFun::MainMenu ( Bar& bar )
{
bar.Add ( t_ ( "File" ), THISBACK ( FileMenu ) );
bar.Add ( t_ ( "Curves" ), THISBACK ( CurvesMenu ) );
bar.Add ( t_ ( "Options" ), THISBACK ( SettingsMenu ) );
bar.Add ( t_ ( "Assist" ), THISBACK ( HelpMenu ) );
}
void GeoFun::HelpMenu ( Bar& bar )
{
bar.Add ( t_ ( "About" ), CtrlImg::information(), THISBACK ( About ) )
.Help ( t_ ( "About GeoFun" ) );
bar.Separator();
bar.Add ( t_ ( "Help" ), CtrlImg::help(), THISBACK ( Help ) )
.Help ( t_ ( "Help GeoFun" ) );
}
GeoFun::GeoFun()
{
CtrlLayout ( *this, "GeoFun : Enjoy Geometric Curves" );
Icon ( GFImg::gficon() );
CtrlLayout ( InputPane );
Sizeable().Zoomable();
InputPane.btnImg << THISBACK1 ( SaveToImageFile, "" );
InputPane.btnPrint << THISBACK ( Print );
InputPane.btnShowAnimation << THISBACK ( SetAnimation );
Add ( dc1.HSizePosZ ( 5, 160 ).VSizePosZ ( 25, 5 ) );
Add ( InputPane.RightPosZ ( 5, 150 ).VSizePosZ ( 2, 5 ) );
BackPaint();
dc1.data.Clear();
// Check config file available else set default data
if ( !cfgAvailable )
{
InputPane.edArmLength.SetData ( 112 ) ;
InputPane.edBaseCircleRad.SetData ( 145 );
InputPane.edPenWidth.SetData ( 3 );
InputPane.edValP.SetData ( 5 );
InputPane.edValQ.SetData ( 12 );
InputPane.edAnimSpeed.SetData ( 5 );
InputPane.LineColor.SetData ( Blue() ) ;
InputPane.FillColorM1.SetData ( LtGreen() ) ;
InputPane.FillColorM2.SetData ( Yellow() ) ;
InputPane.FillColorB1.SetData ( Blue() ) ;
InputPane.FillColorB2.SetData ( LtCyan() ) ;
InputPane.optGradient.Set ( 1 );
InputPane.optColorFill.Set ( 1 );
InputPane.CurveType.SetData ( 2 );
}
InputPane.CurveType.WhenAction << THISBACK (SetCurveTypeMenu1);
InputPane.optGradient.WhenAction << THISBACK ( PrepareData );
InputPane.optColorFill.WhenAction << THISBACK ( PrepareData );
InputPane.FillColorB1.WhenAction << THISBACK ( PrepareData );
InputPane.FillColorB2.WhenAction << THISBACK ( PrepareData );
InputPane.FillColorM1.WhenAction << THISBACK ( PrepareData );
InputPane.FillColorM2.WhenAction << THISBACK ( PrepareData );
InputPane.LineColor.WhenAction << THISBACK ( PrepareData );
InputPane.edPenWidth.WhenAction << THISBACK ( PrepareData );
InputPane.edValP.WhenAction << THISBACK ( PrepareData );
InputPane.edValQ.WhenAction << THISBACK ( PrepareData );
InputPane.edArmLength.WhenAction << THISBACK ( PrepareData );
InputPane.edBaseCircleRad.WhenAction << THISBACK ( PrepareData );
InputPane.edAnimSpeed.WhenAction << THISBACK ( SetAnimationSpeed );
InputPane.optZoom.WhenAction << THISBACK ( PrepareData );
// Set timercallback to do first painting with calculations
// You can not call this directly from constructor
SetTimeCallback ( 200, THISBACK ( FirstDraw ) );
dc1.ShowTo = 5 ; // start point of animation.
menu.Set ( THISBACK ( MainMenu ) );
}
GUI_APP_MAIN
{
GeoFun gf ;
gf.First = true ;
String cfgfile = ConfigFile();
if ( FileExists ( cfgfile ) )
{
cfgAvailable = true ;
if ( !LoadFromFile ( gf, cfgfile ) )
{
cfgAvailable = false ;
Exclamation ( "Error loading configuration file!" );
}
}
else
{
cfgAvailable = false ;
}
// gf.Icon(Image::(5555, true), Image::ICON(5555, false));
gf.Run();
StoreToFile ( gf );
}
GeoFun.lay
LAYOUT(GeoFunLayout, 680, 484)
ITEM(MenuBar, menu, LeftPosZ(4, 536).TopPosZ(4, 20))
END_LAYOUT
LAYOUT(InputLayout, 150, 464)
ITEM(EditDoubleSpin, edBaseCircleRad, SetInc(5).AlignRight(true).LeftPosZ(84, 60).TopPosZ(16, 19))
ITEM(EditDoubleSpin, edArmLength, SetInc(5).AlignRight(true).LeftPosZ(84, 60).TopPosZ(36, 19))
ITEM(EditIntSpin, edValP, AlignRight(true).LeftPosZ(84, 60).TopPosZ(56, 19))
ITEM(EditIntSpin, edValQ, AlignRight(true).LeftPosZ(84, 60).TopPosZ(76, 19))
ITEM(EditIntSpin, edPenWidth, AlignRight(true).LeftPosZ(84, 60).TopPosZ(96, 19))
ITEM(Switch, CurveType, SetLabel(t_("Epicycloid\nHypocycloid\nEpitrochoid\nHypotrochoid")).LeftPosZ(8, 128).TopPosZ(260, 64))
ITEM(LabelBox, InputData, SetLabel(t_("Input Data")).LeftPosZ(4, 144).TopPosZ(0, 324))
ITEM(Option, optZoom, SetLabel(t_("Zoom to Fit")).LeftPosZ(12, 124).TopPosZ(224, 16))
ITEM(Option, optGradient, SetLabel(t_("Gradient Fill")).LeftPosZ(12, 124).TopPosZ(208, 16))
ITEM(Option, optColorFill, SetLabel(t_("Color Fill")).LeftPosZ(12, 124).TopPosZ(192, 16))
ITEM(ColorPusher, LineColor, LeftPosZ(84, 28).TopPosZ(124, 16))
ITEM(ColorPusher, FillColorM1, LeftPosZ(84, 28).TopPosZ(144, 16))
ITEM(ColorPusher, FillColorM2, HSizePosZ(112, 10).TopPosZ(144, 16))
ITEM(ColorPusher, FillColorB1, LeftPosZ(84, 28).TopPosZ(168, 16))
ITEM(ColorPusher, FillColorB2, HSizePosZ(112, 10).TopPosZ(168, 16))
ITEM(Label, dv___15, SetLabel(t_("Fill Color Back")).SetAlign(ALIGN_RIGHT).LeftPosZ(0, 76).TopPosZ(164, 20))
ITEM(Label, dv___16, SetLabel(t_("Fill Color Main")).SetAlign(ALIGN_RIGHT).LeftPosZ(0, 76).TopPosZ(144, 16))
ITEM(Label, dv___17, SetLabel(t_("Curve Type")).SetFont(StdFont().Bold()).LeftPosZ(8, 128).TopPosZ(240, 18))
ITEM(Label, dv___18, SetLabel(t_("Line Color")).SetAlign(ALIGN_RIGHT).LeftPosZ(0, 76).TopPosZ(124, 16))
ITEM(Label, dv___19, SetLabel(t_("Vertex Points")).SetAlign(ALIGN_RIGHT).LeftPosZ(0, 76).TopPosZ(72, 26))
ITEM(Label, dv___20, SetLabel(t_("Draw Radius")).SetAlign(ALIGN_RIGHT).LeftPosZ(0, 76).TopPosZ(32, 26))
ITEM(Label, dv___21, SetLabel(t_("Revolutions")).SetAlign(ALIGN_RIGHT).LeftPosZ(0, 76).TopPosZ(52, 26))
ITEM(Label, dv___22, SetLabel(t_("Base Radius")).SetAlign(ALIGN_RIGHT).LeftPosZ(8, 68).TopPosZ(12, 26))
ITEM(Label, dv___23, SetLabel(t_("Width")).SetAlign(ALIGN_RIGHT).LeftPosZ(0, 76).TopPosZ(96, 20))
ITEM(EditIntSpin, edAnimSpeed, LeftPosZ(84, 44).TopPosZ(412, 28))
ITEM(Label, dv___25, SetLabel(t_("Animation\nSpeed")).SetAlign(ALIGN_RIGHT).LeftPosZ(0, 76).TopPosZ(412, 28))
ITEM(Label, RollingRad, SetLabel(t_("Rolling Radius")).LeftPosZ(4, 140).TopPosZ(440, 20))
ITEM(Button, btnImg, SetLabel(t_("Save as Image")).HSizePosZ(4, 6).TopPosZ(356, 24))
ITEM(Button, btnPrint, SetLabel(t_("Print")).HSizePosZ(4, 6).TopPosZ(384, 24))
ITEM(Button, btnShowAnimation, SetLabel(t_("Animated Plot")).HSizePosZ(4, 6).TopPosZ(328, 24))
END_LAYOUT
LAYOUT(HelpDialogLayout, 400, 200)
END_LAYOUT
LAYOUT(AboutLayout, 480, 320)
ITEM(LabelBox, dv___0, SetLabel(t_("GeoFun")).HSizePosZ(4, 4).VSizePosZ(4, 24))
ITEM(RichTextCtrl, AboutText, HSizePosZ(8, 8).VSizePosZ(20, 28))
ITEM(Button, ok, SetLabel(t_("OK")).LeftPosZ(8, 464).TopPosZ(300, 15))
END_LAYOUT
|