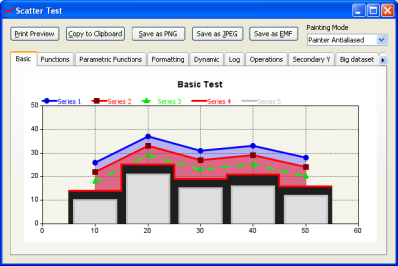
ScatterCtrl Demo
Scatter series in GUI applications
ScatterCtrl_Demo package does a visual review of ScatterCtrl class features.
Here there are some screenshots:
General view
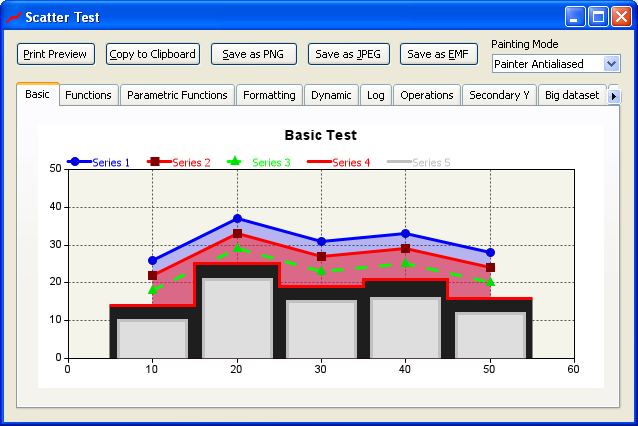
Demo program contains control samples in different tabs.
All of them have different export possibilities like:
Print Preview
Export as PNG
Export as JPEG
Export as EMF
Copy to Clipboard
Scatter controls lets to export in more formats.
In addition there are different painting modes to let either smoother or faster plots.
|
|
|
|
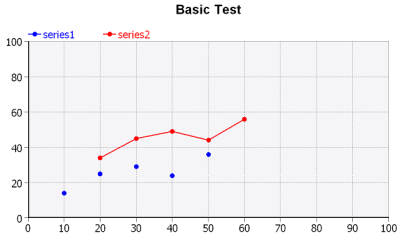
Basic Test
Scatter lets to show different data series changing various parameters like color, line width, dot style.
|
|
|
|
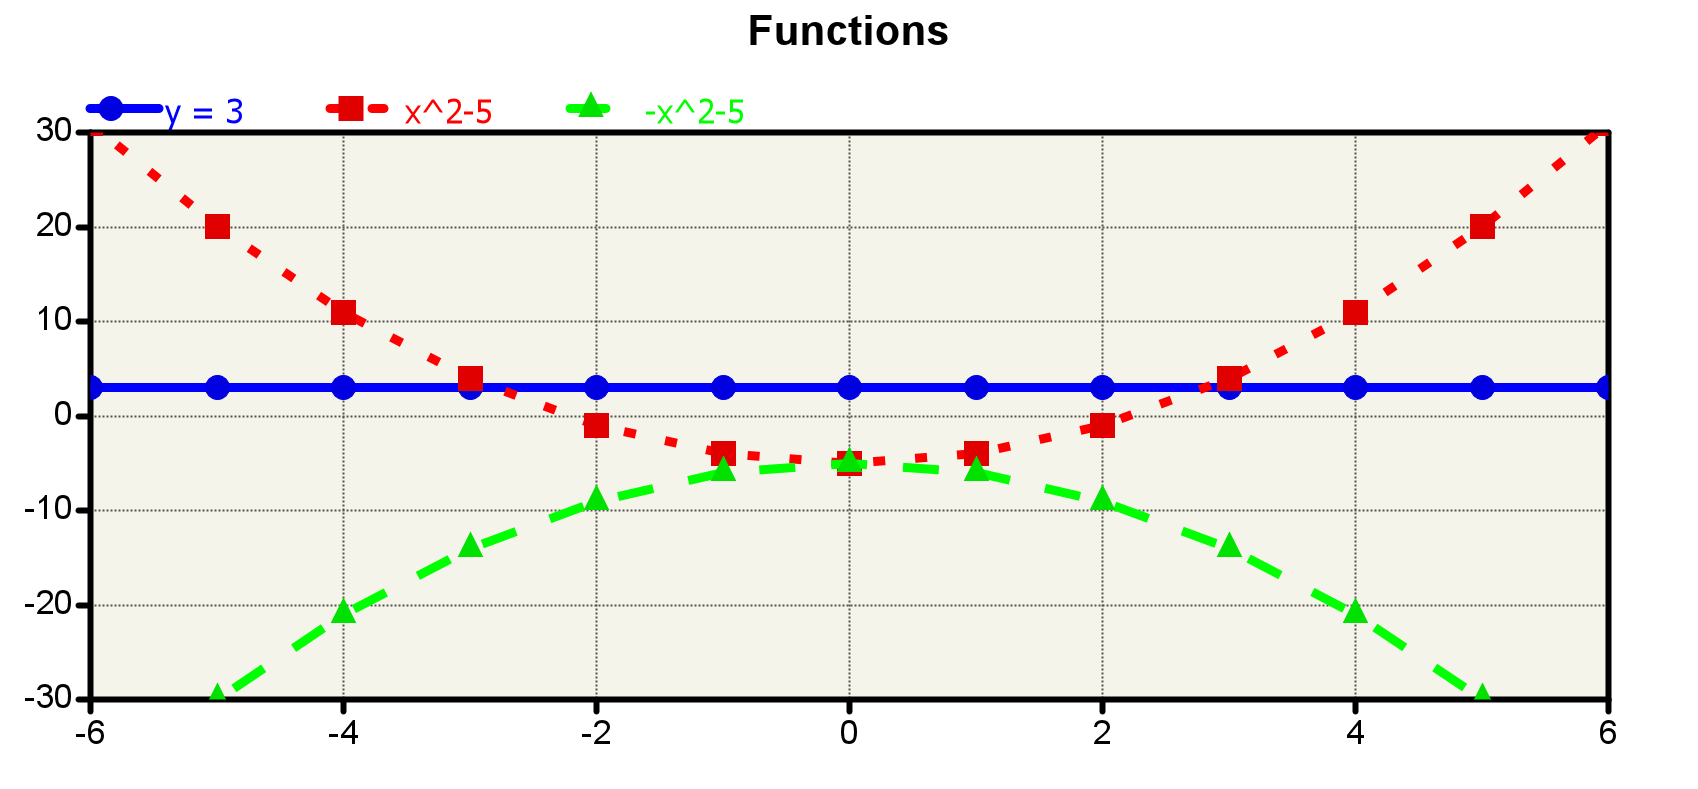
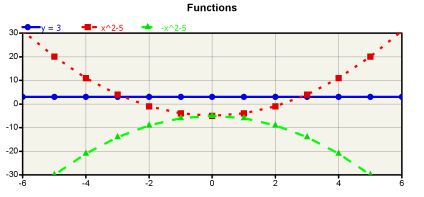
Functions
Using PlotFunction() it is possible to directly draw functions instead of just stored data.
|
|
|
|
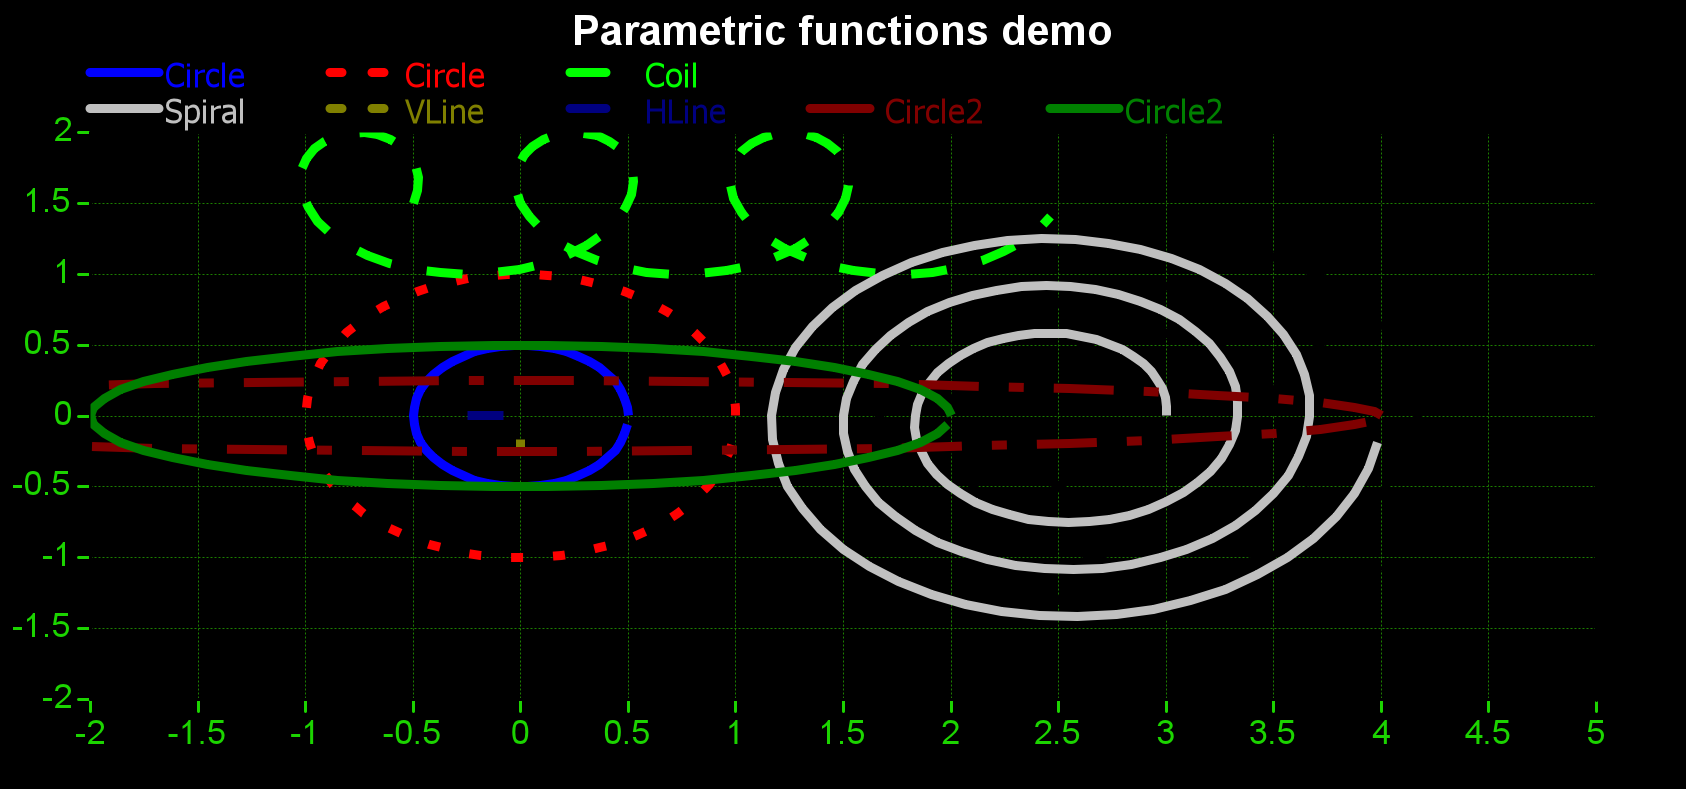
Parametric Functions
While PlotFunction() functions just return the vertical axis, PlotParaFunction() functions return the XY coordinates of every point.
This options lets full freedom inserting XY series.
|

|
|
|
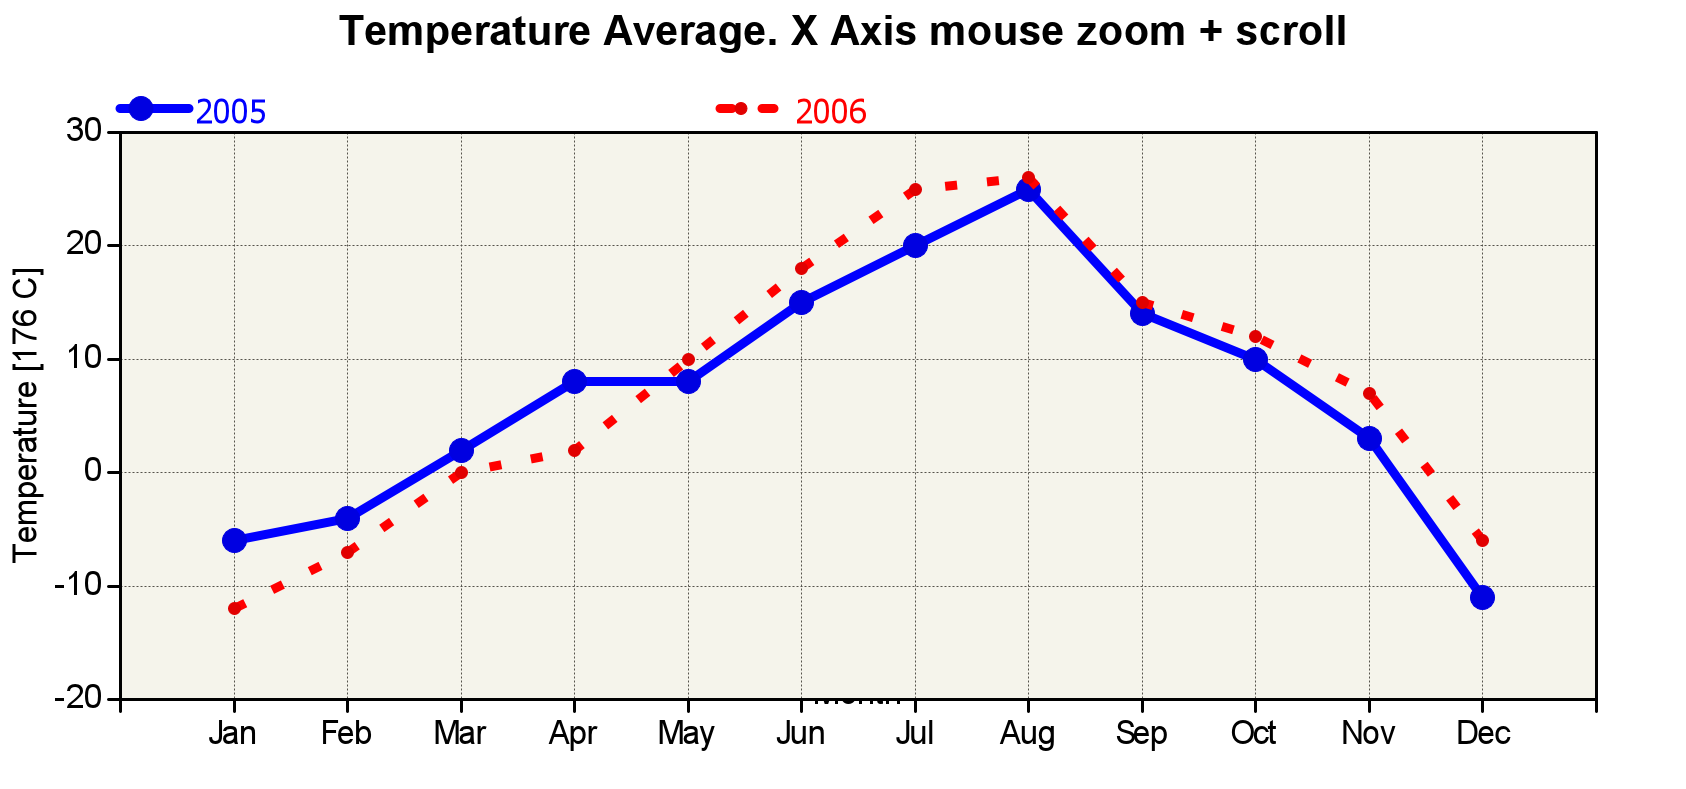
Formatting
ScatterDraw/ScatterCtrl lets to insert X and Y labels, XY scaling and range, point format and size and standard or user defined axis labels formating.
In addition SetMouseHandling(true) lets to use the mouse to zoom and move the graphs in X axis.
|

|
|
|
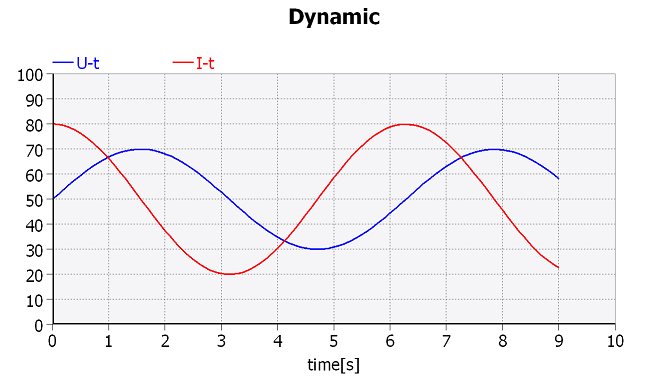
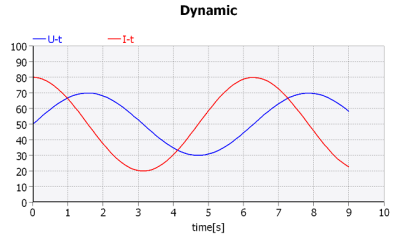
Dynamic
ScatterCtrl is not an static control and easily lets to include dynamic series handling.
|
|
|
|
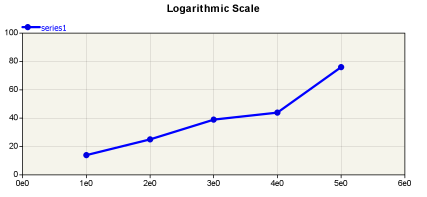
Log
Versatile axis scaling and labeling through cbModifFormatX and cbModifFormatY lets to include not only time and date axis but also logarithmic ones.
|
|
|
|
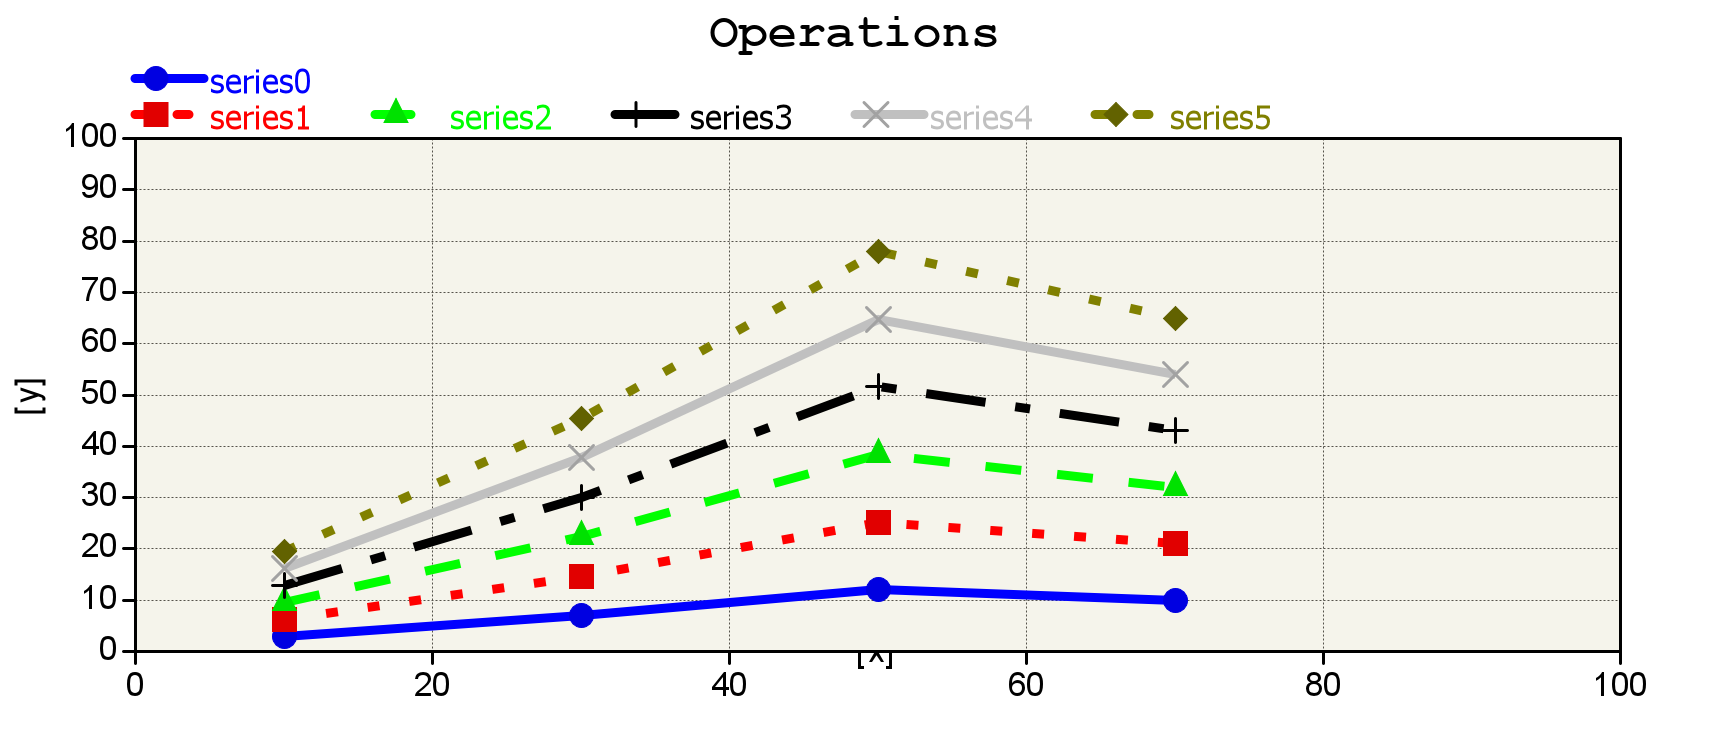
Operations
Series dynamic handling is easy. This demo lets the user to add and remove series.
|

|
|
|
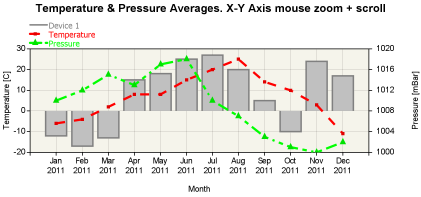
Secondary Y axis
It is possible to add a secondary right side vertical Y axis and scale data series to it.
In addition SetMouseHandling(true, true) lets to use the mouse to zoom and move the graphs in X and Y axis.
|
|
|
|
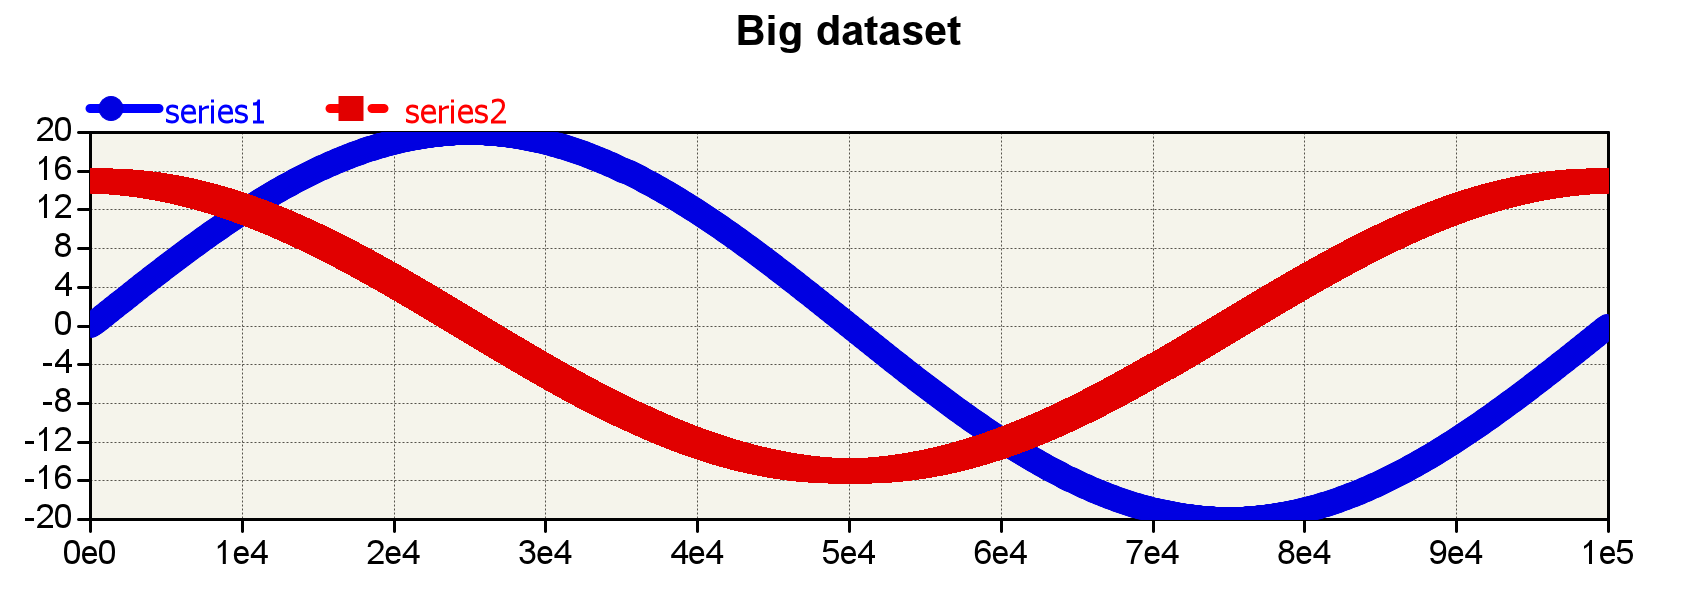
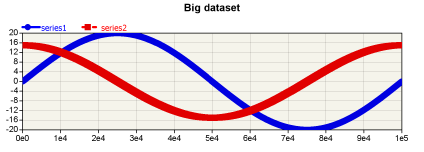
Big datasets
Big datasets are hard to handle. However there are two functions that speed up dramatically ScatterDraw/ScatterCtrl response in X axis sequential datasets like time series:
SetSequentialX: Indicates that the data has been sequentially inserted following X axis
SetFastViewX: Indicates that it will be viewed a point per horizontal pixel. This point will be the average of all data that is in that pixel
|
|
|
|
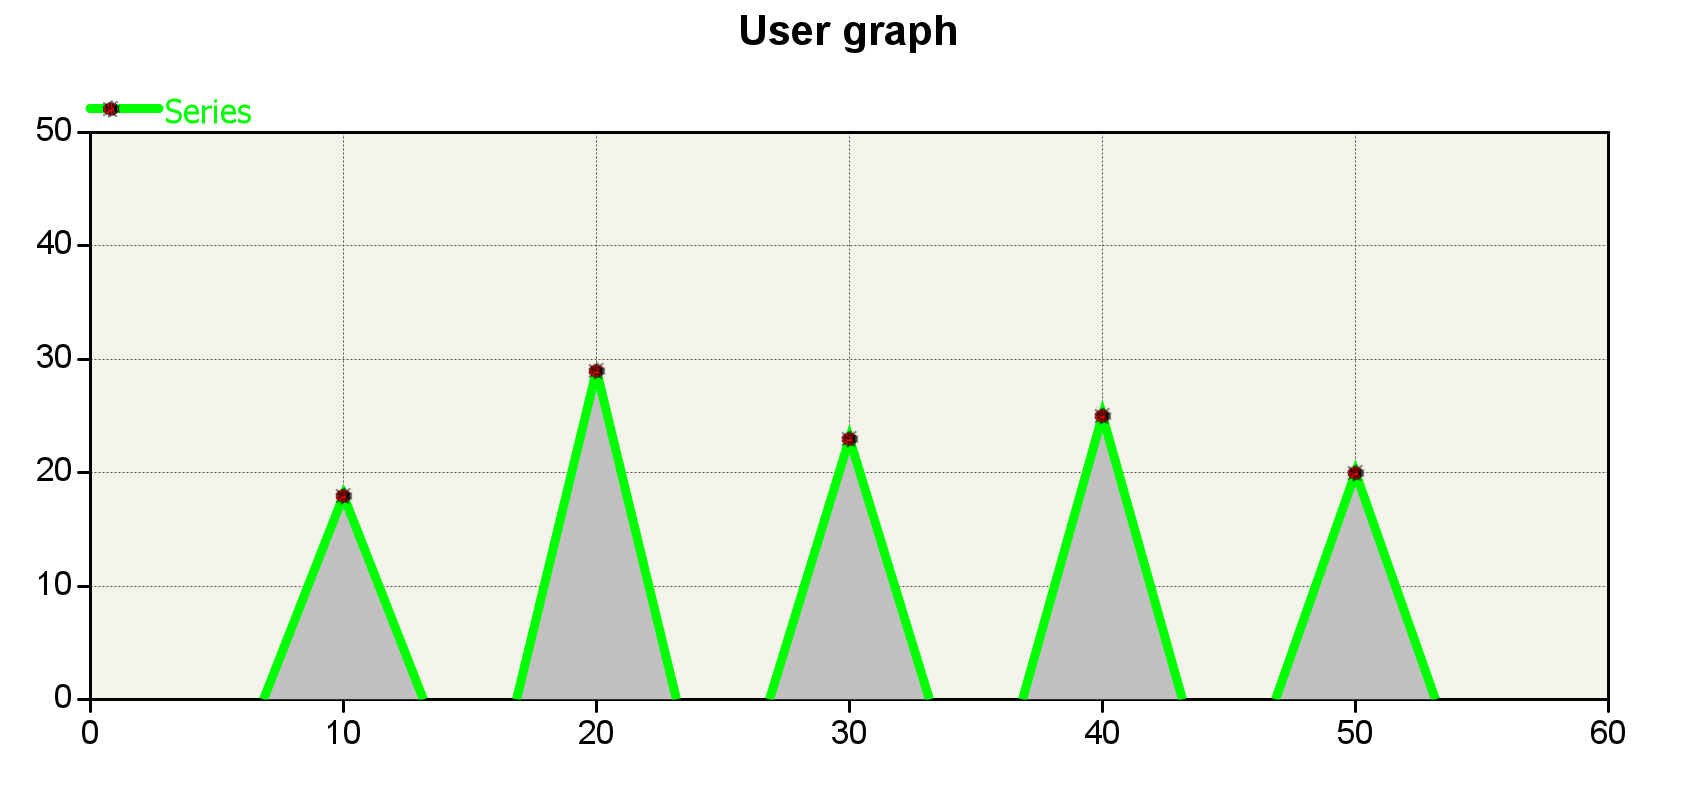
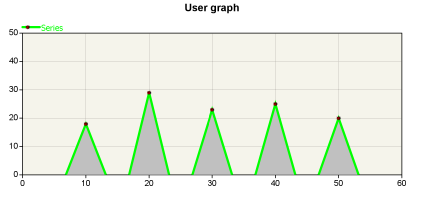
User graph
User can set custom graph types and marks.
|
|
|
|
ScatterCtrl_Demo.h
#ifndef _ScatterCtrl_Demo_ScatterCtrl_Demo_h
#define _ScatterCtrl_Demo_ScatterCtrl_Demo_h
#include <ScatterCtrl/ScatterCtrl.h>
#include <ScatterCtrl/PieCtrl.h>
using namespace Upp;
#define LAYOUTFILE <ScatterCtrl_Demo/ScatterCtrl_Demo.lay>
#include <CtrlCore/lay.h>
#define IMAGECLASS MyImages
#define IMAGEFILE <ScatterCtrl_Demo/ScatterCtrl_Demo.iml>
#include <Draw/iml_header.h>
struct ScatterDemo : StaticRect {
virtual void Init() {};
virtual ScatterCtrl &Scatter() = 0;
};
void RegisterExample(const char *name, ScatterDemo* (*ctrl)(), String fileName);
class Tab1_Basic : public WithTab1Basic<ScatterDemo> {
public:
typedef Tab1_Basic CLASSNAME;
virtual void Init();
virtual ScatterCtrl &Scatter() {return scatter;};
private:
Vector<Pointf> sDemoRed1, sDemoRed2,sDemoGreen;
Vector<Pointf> s1;
double s2y[5];
double s3x[5], s3y[5];
Vector<double> s4x, s4y;
VectorMap<double, double> s5;
};
class Tab2_Functions : public WithTab2Functions<ScatterDemo> {
public:
typedef Tab2_Functions CLASSNAME;
void Init();
virtual ScatterCtrl &Scatter() {return scatter;};
class MySource : public FuncSource {
public:
void Init(double data) {
this->data = data;
function = [=](double x) {return Calc(x);};
}
double Calc(double x);
private:
double data;
};
MySource source;
};
class Tab3_ParametricFunctions : public WithTab3ParametricFunctions<ScatterDemo> {
public:
typedef Tab3_ParametricFunctions CLASSNAME;
void Init();
virtual ScatterCtrl &Scatter() {return scatter;};
};
class Tab4_Formatting : public WithTab4Formatting<ScatterDemo> {
public:
typedef Tab4_Formatting CLASSNAME;
void Init();
virtual ScatterCtrl &Scatter() {return scatter;};
private:
Vector<Pointf> s1, s2;
};
class Tab5_Dynamic : public WithTab5Dynamic<ScatterDemo> {
public:
typedef Tab5_Dynamic CLASSNAME;
void Init();
void Animate();
void Start();
void Stop();
void Reset();
void PgDown();
void PgUp();
void Plus();
void Minus();
virtual ScatterCtrl &Scatter() {return scatter;};
private:
double t;
Vector<Pointf> s1, s2;
};
class Tab6_Logarithmic : public WithTab6Logarithmic<ScatterDemo> {
public:
typedef Tab6_Logarithmic CLASSNAME;
void Init();
void FormatX(String& s, int i, double d);
void FormatXGridUnits(String& s, int i, double d);
void SetGridLinesX(Vector<double>& unitsX);
virtual ScatterCtrl &Scatter() {return scatter;};
private:
Vector<Pointf> s1;
};
class Tab7_Operations : public WithTab7Operations<ScatterDemo> {
public:
typedef Tab7_Operations CLASSNAME;
void Init();
void AddSeries();
void RemoveFirstSeries();
void RemoveLastSeries();
void RemoveAllSeries();
virtual ScatterCtrl &Scatter() {return scatter;};
private:
Array<Vector<Pointf> > series;
};
class Tab8_Secondary : public WithTab8Secondary<ScatterDemo> {
public:
typedef Tab8_Secondary CLASSNAME;
void Init();
void MyFormat(String& s, int i, double d)
{
s = Format("%Mon", fround(d));
if (!s.IsEmpty())
s << "\n2011";
}
void MyFormatDelta(String& s, int i, double d)
{
s = FormatDouble(d, 1) + " " + t_("months");
}
virtual ScatterCtrl &Scatter() {return scatter;};
private:
Vector<Pointf> s1, s2, s3;
};
class Tab9_Big : public WithTab9Big<ScatterDemo> {
public:
typedef Tab9_Big CLASSNAME;
void Init();
void OnFastView() {scatter.SetFastViewX(fastView);};
void OnSequentialX() {scatter.SetSequentialXAll(sequentialX);};
virtual ScatterCtrl &Scatter() {return scatter;};
private:
Vector<Pointf> s1,s2;
};
class Tab10_User : public WithTab10User<ScatterDemo> {
public:
typedef Tab10_User CLASSNAME;
void Init();
virtual ScatterCtrl &Scatter() {return scatter;};
private:
double sx[5], sy[5];
};
class Tab11_Trend : public WithTab11Trend<ScatterDemo> {
public:
typedef Tab11_Trend CLASSNAME;
Tab11_Trend() {};
void Init();
void OnSeries();
virtual ScatterCtrl &Scatter() {return scatter;};
private:
Vector<double> s1x, s1y;
Vector<double> s2x, s2y;
LinearEquation linear;
PolynomialEquation poly2, poly4;
FourierEquation fourier;
ExponentialEquation exponential;
Rational1Equation rational1;
SinEquation sin;
};
class Tab12_Linked : public WithTab12Linked<ScatterDemo> {
public:
typedef Tab12_Linked CLASSNAME;
virtual void Init();
virtual ScatterCtrl &Scatter() {return scatter1;};
private:
Vector<Pointf> s1, s2, s3;
void OnLink();
};
class TabUserEquation : public WithTabUserEquation<ScatterDemo> {
public:
typedef TabUserEquation CLASSNAME;
virtual void Init();
void OnUpdate();
virtual ScatterCtrl &Scatter() {return scatter;};
private:
UserEquation userEquation;
};
class TabRangePlot : public WithTabRangePlot<ScatterDemo> {
public:
typedef TabRangePlot CLASSNAME;
void Init();
virtual ScatterCtrl &Scatter() {return scatter;};
private:
Vector<Vector <double> > s1, s2;
Vector<int> idsRange;
Vector<Pointf> sdata, smin, smax;
VectorPointf dmin, dmax;
DataRange range;
};
class TabStackedPlot : public WithTabStackedPlot<ScatterDemo> {
public:
typedef TabStackedPlot CLASSNAME;
void Init();
virtual ScatterCtrl &Scatter() {return scatter;};
void OnPlot();
private:
Vector<Pointf> s1, s2, s3;
VectorPointf ds1, ds2, ds3;
DataStackedY stacked;
};
class TabBubblePlot : public WithTabBubblePlot<ScatterDemo> {
public:
typedef TabBubblePlot CLASSNAME;
void Init();
virtual ScatterCtrl &Scatter() {return scatter;};
private:
Vector<Vector <double> > s1;
Vector<int> idsBubble;
Vector<String> labels;
};
class Tab_UserPaint : public WithTabUserPaint<ScatterDemo> {
public:
typedef Tab_UserPaint CLASSNAME;
virtual void Init();
virtual ScatterCtrl &Scatter() {return scatter;};
void OnPainter(Painter &w) {OnPaint(w);}
void OnDraw(Draw &w) {OnPaint(w);}
template <class T>
void OnPaint(T& w) {
int plotW = scatter.GetPlotWidth(), plotH = scatter.GetPlotHeight();
DrawLineOpa(w, 0, 0, plotW, plotH, 1, 1, 1, LtRed(), "2 2");
DrawText(w, plotW/5, plotH/5, 0, "Fixed line", Arial(15), Black());
String text = "Fixed text";
Font font = Arial(30);
Size sz = GetTextSizeSpace(text, font);
FillRectangleOpa(w, plotW - sz.cx - 10, 10, plotW - 10, 10 + sz.cy, 0.3, Null, LtGreen());
DrawText(w, plotW - sz.cx - 10, 10, 0, text, font, Black());
if (scatter.GetXMin() < 1 && scatter.GetXMax() > 1) {
Pointf p;
for (int i = 0; i < s1.GetCount(); ++i) {
if (s1[i].x >= 1) {
p = s1[i];
break;
}
}
if (scatter.GetYMin() < p.y && scatter.GetYMax() > p.y) {
double posx = scatter.GetPosX(p.x);
double posy = scatter.GetPosY(p.y);
double sizex = scatter.GetSizeX(0.2);
FillRectangleOpa(w, posx - sizex/2., posy - sizex/2.,
posx + sizex/2., posy + sizex/2.,
0.8, Null, LtGreen());
Vector<Pointf> s;
s << Pointf(posx - sizex/2., posy - sizex/2.)
<< Pointf(posx + sizex/2., posy - sizex/2.)
<< Pointf(posx + sizex/2., posy + sizex/2.)
<< Pointf(posx - sizex/2., posy + sizex/2.)
<< Pointf(posx - sizex/2., posy - sizex/2.);
DrawPolylineOpa(w, s, 1, 1, 2, Green(), "", Null);
DrawText(w, posx + sizex/2., posy, 0, Format("Pos %.2f, %.2f fixed font", p.x, p.y), Arial(15), Black());
double sizeT = scatter.GetSizeY(0.05);
Font font = Arial((int)sizeT);
DrawText(w, posx + sizex/2., posy + 15, 0, Format("Pos %.2f, %.2f scaled font", p.x, p.y), font, Black());
}
}
}
private:
Vector<Pointf> s1;
};
class Tab19_Surf : public WithTabSurf<ScatterDemo> {
public:
typedef Tab19_Surf CLASSNAME;
virtual void Init();
virtual ScatterCtrl &Scatter() {return scatter;};
void OnChange();
void Init_DatasetSimple();
void Init_Dataset();
void Init_DataExplicit();
private:
ExplicitData funData;
TableDataVector data;
TableDataVector dataFun;
Vector<double> zData, xAxis, yAxis;
Vector<double> zDataFun, xAxisFun, yAxisFun;
Vector<Pointf> isolines, numbersPos;
Vector<String> labels;
};
class TabPie : public WithTabPie<StaticRect> {
public:
typedef TabPie CLASSNAME;
void Init();
};
class ScatterCtrl_Demo : public WithScatterCtrl_Demo<TopWindow> {
typedef ScatterCtrl_Demo CLASSNAME;
public:
ScatterCtrl_Demo();
TabPie tabPie;
private:
void Preview();
void SavePNG();
void SaveJPG();
#ifdef PLATFORM_WIN32
void SaveEMF();
#endif
void CopyClipboard();
void SetMode();
void OnSel();
Vector<StaticRect *> examplesRects;
};
#endif
tab14_UserEquation.cpp
#include "ScatterCtrl_Demo.h"
void TabUserEquation::Init()
{
CtrlLayout(*this);
SizePos();
equation <<= "25 + 10*sin(0.5*x + 5)";
fromX <<= 0;
toX <<= 100;
fromY <<= 0;
toY <<= 50;
update.WhenAction = THISBACK(OnUpdate);
scatter.SetMouseHandling(true, true).ShowContextMenu().ShowPropertiesDlg().ShowProcessDlg();
OnUpdate();
}
void TabUserEquation::OnUpdate()
{
if (fromX >= toX || fromY >= toY) {
Exclamation("Wrong limits");
return;
}
userEquation.Init("Reach flow (Coull)", ~equation);
scatter.RemoveAllSeries();
scatter.AddSeries(userEquation).Legend(userEquation.GetFullName()).NoMark().Stroke(2).Units("m3/s");
scatter.SetXYMin(fromX, fromY);
scatter.SetRange(toX - fromX, toY - fromY);
scatter.ZoomToFit(true, true);
}
ScatterDemo *ConstructUserEquation()
{
static TabUserEquation tab;
return &tab;
}
INITBLOCK {
RegisterExample("User equation", ConstructUserEquation, __FILE__);
}
tab13.cpp
#include "ScatterCtrl_Demo.h"
void Tab12::Init()
{
CtrlLayout(*this);
HSizePos().VSizePos();
s1 << Pointf(50, 10) << Pointf(100, 20) << Pointf(150, 30) << Pointf(200, 20) << Pointf(250, 10);
scatter.AddSeries(s1).Legend("Series 1").Fill();
scatter.SetXYMin(50, 0).SetRange(200, 40).SetMajorUnits(50, 10).SetPolar();
scatter.ShowInfo().ShowContextMenu().ShowPropertiesDlg().SetPopText("h", "v", "v2").SetMouseHandling(true, true);
}
ScatterDemo *Construct12()
{
static Tab12 tab;
return &tab;
}
INITBLOCK {
RegisterExample("Polar plot", Construct12, __FILE__);
}
main.cpp
#include "ScatterCtrl_Demo.h"
#include <Report/Report.h>
#include <PdfDraw/PdfDraw.h>
#define IMAGECLASS MyImages
#define IMAGEFILE <ScatterCtrl_Demo/ScatterCtrl_Demo.iml>
#include <Draw/iml_source.h>
struct Example {
ScatterDemo* (*ctrl)();
String name;
int index;
};
Array<Example>& Examples()
{
static Array<Example> x;
return x;
}
void RegisterExample(const char *name, ScatterDemo* (*ctrl)(), String fileName)
{
Example& x = Examples().Add();
x.name = name;
x.ctrl = ctrl;
x.index = ScanInt(GetFileName(fileName).Mid(3, 2));
}
bool CompareExamples(Example &a, Example &b) {return a.index < b.index;}
GUI_APP_MAIN
{
Sort(Examples(), CompareExamples);
ScatterCtrl_Demo().Run();
}
ScatterCtrl_Demo::ScatterCtrl_Demo()
{
CtrlLayout(*this, "Scatter Test");
for (int i = 0; i < Examples().GetCount(); ++i)
Examples()[i].ctrl()->Init();
examplesList.NoHorzGrid().NoVertGrid();
examplesList.AddColumn("Example name");
for (int i = 0; i < Examples().GetCount(); ++i) {
examplesList.Add(Examples()[i].name);
Add((*(Examples()[i].ctrl())).HSizePosZ(180, 4).VSizePosZ(4, 8));
examplesRects.Add(Examples()[i].ctrl());
}
examplesList.Add("Pie chart");
tabPie.Init();
Add(tabPie.HSizePosZ(180, 4).VSizePosZ(4, 8));
examplesRects.Add(&tabPie);
for (int i = 0; i < examplesRects.GetCount(); ++i)
examplesRects[i]->Hide();
bPreview <<= THISBACK(Preview);
bSavePNG <<= THISBACK(SavePNG);
bSaveJPG <<= THISBACK(SaveJPG);
#ifdef PLATFORM_WIN32
bSaveEMF <<= THISBACK(SaveEMF);
#else
bSaveEMF.Hide();
#endif
bCopyClipboard <<= THISBACK(CopyClipboard);
paintMode.Add(ScatterDraw::MD_ANTIALIASED, "Painter Antialiased")
.Add(ScatterDraw::MD_NOAA, "Painter No-Antialiased")
.Add(ScatterDraw::MD_SUBPIXEL, "Painter Subpixel")
.Add(ScatterDraw::MD_DRAW, "Draw");
paintMode <<= THISBACK(SetMode);
paintMode.SetData(ScatterDraw::MD_ANTIALIASED);
SetMode();
examplesList.WhenSel = THISBACK(OnSel);
examplesList.SetCursor(17);
OnSel();
Sizeable().Zoomable().Icon(MyImages::i1());
}
void ScatterCtrl_Demo::OnSel()
{
for (int i = 0; i < examplesRects.GetCount(); ++i)
examplesRects[i]->Hide();
if (examplesList.GetCursor() < 0)
return;
examplesRects[examplesList.GetCursor()]->Show();
}
void ScatterCtrl_Demo::Preview()
{
Report r;
r.Landscape();
Size pageSize = r.GetPageSize();
const Drawing &w = Examples()[examplesList.GetCursor()].ctrl()->Scatter().GetDrawing();
r.DrawDrawing(0, 0, pageSize.cx, pageSize.cy, w);
Perform(r);
}
void ScatterCtrl_Demo::SavePNG()
{
int ntab = examplesList.GetCursor();
Examples()[ntab].ctrl()->Scatter().SaveToFile(AppendFileName(GetDesktopFolder(), Format("scatter%d.png", ntab)));
}
void ScatterCtrl_Demo::SaveJPG()
{
int ntab = examplesList.GetCursor();
Examples()[ntab].ctrl()->Scatter().SaveToFile(AppendFileName(GetDesktopFolder(), Format("scatter%d.jpg", ntab)));
}
#ifdef PLATFORM_WIN32
void ScatterCtrl_Demo::SaveEMF()
{
int ntab = examplesList.GetCursor();
Examples()[ntab].ctrl()->Scatter().SaveAsMetafile(AppendFileName(GetDesktopFolder(), Format("scatter%d.emf", ntab)));
}
#endif
void ScatterCtrl_Demo::CopyClipboard()
{
Examples()[examplesList.GetCursor()].ctrl()->Scatter().SaveToClipboard();
}
void ScatterCtrl_Demo::SetMode()
{
for (int i = 0; i < Examples().GetCount(); ++i)
Examples()[i].ctrl()->Scatter().SetMode(~paintMode);
}
tab17_BubblePlot.cpp
#include "ScatterCtrl_Demo.h"
void TabBubblePlot::Init()
{
CtrlLayout(*this);
SizePos();
scatter.SetMouseHandling(true, true).ShowContextMenu();
for (double size = 0; size <= 10; size += 2.) {
Vector<double> &data = s1.Add();
double x = size;
double y = (10 + 10*Random(30)*size);
double diameter = Random(80);
data << x << y << diameter;
labels << Format("%.0f cm", diameter);
}
idsBubble << 2;
static Vector<int> idVoid;
scatter.AddSeries(s1, 0, 1, idVoid, idVoid, idsBubble).Legend("Importance").MarkStyle<BubblePlot>()
.MarkColor(Green()).MarkBorderColor(LtRed()).MarkBorderWidth(3)
.AddLabelSeries(labels, 0, 0, StdFont().Height(15).Bold(), ALIGN_CENTER);
scatter.SetLabelY("Size").Responsive();
scatter.ZoomToFit(true, true, 0.2);
}
ScatterDemo *Construct17()
{
static TabBubblePlot tab;
return &tab;
}
INITBLOCK {
RegisterExample("BubblePlot", Construct17, __FILE__);
}
tab1_Basic.cpp
#include "ScatterCtrl_Demo.h"
enum {
SERIE2
};
void Tab1_Basic::Init()
{
CtrlLayout(*this);
SizePos();
s1 << Pointf(12, 26) << Pointf(20, 37) << Pointf(30, 31) << Pointf(40, 33) << Pointf(50, 28);
scatter.AddSeries(s1).Legend("Series 1").Opacity(0.3).Fill().MarkBorderColor();
s2y[0] = 22; s2y[1] = 33; s2y[2] = 27; s2y[3] = 29; s2y[4] = 24;
scatter.AddSeries(s2y, 5, 10, 10).Legend("Series 2").Id(SERIE2).PlotStyle<LineSeriesPlot>()
.Dash("").MarkColor(Red()).Fill().Opacity(0.5).MarkBorderColor();
s3y[0] = 18; s3y[1] = 29; s3y[2] = 23; s3y[3] = 25; s3y[4] = 20;
s3x[0] = 8; s3x[1] = 20; s3x[2] = 30; s3x[3] = 40; s3x[4] = 50;
scatter.AddSeries(s3x, s3y, 5).Legend("Series 3").MarkBorderColor();
s4y << 14 << 25 << 19 << 21 << 16;
s4x << 10 << 20 << 30 << 40 << 50;
scatter.AddSeries(s4x, s4y).Legend("Series 4").PlotStyle<StaggeredSeriesPlot>().Dash("").NoMark().Fill().Stroke(3, LtRed());
s5.Add(10, 10);
s5.Add(20, 21);
s5.Add(30, 15);
s5.Add(40, 16);
s5.Add(50, 12);
int barWidth = 4;
scatter.AddSeries(s5).Legend("Series 5").PlotStyle<BarSeriesPlot>().BarWidth(barWidth).Dash("").NoMark().Fill();
scatter.SetRange(60, 50).SetMajorUnits(10, 10);
scatter.ShowInfo().ShowContextMenu().ShowPropertiesDlg().ShowProcessDlg().SetPopText("h", "v", "v2").SetMouseHandling(true, true);
scatter.SetLegendPos(Point(20, 20));
}
ScatterDemo *Construct1()
{
static Tab1_Basic tab;
return &tab;
}
INITBLOCK {
RegisterExample("Basic", Construct1, __FILE__);
}
tab12_Linked.cpp
#include "ScatterCtrl_Demo.h"
void Tab12_Linked::Init()
{
CtrlLayout(*this);
SizePos();
scatter1.SetRange(1000, 40).SetXYMin(0, -20);
scatter1.SetMouseHandling(true).SetMaxRange(5000).SetMinRange(2);
scatter2.SetRange(1000, 40).SetXYMin(0, -20);
scatter2.SetMouseHandling(true).SetMaxRange(5000).SetMinRange(2);
scatter3.SetRange(1000, 40).SetXYMin(0, -20);
scatter3.SetMouseHandling(true).SetMaxRange(5000).SetMinRange(2);
for (int t = 0; t < 3000; ++t) {
s1 << Pointf(t, 20*sin(6*M_PI*t/500) + 5*sin(3*M_PI*t/500 + M_PI/3) + 2*sin(14*M_PI*t/500 + M_PI/5));
s2 << Pointf(t, 50*sin(6*1.1*M_PI*t/500));
s3 << Pointf(t, 20*sin(6*1.2*M_PI*t/500));
}
scatter1.AddSeries(s1).Legend("Series 1").NoMark().Stroke(2, LtRed());
scatter2.AddSeries(s2).Legend("Series 2").NoMark().Stroke(2, LtBlue());
scatter3.AddSeries(s3).Legend("Series 3").NoMark().Stroke(2, LtGreen());
scatter1.ShowInfo().ShowContextMenu().ShowPropertiesDlg().ShowProcessDlg();
scatter2.ShowInfo().ShowContextMenu().ShowPropertiesDlg().ShowProcessDlg();
scatter3.ShowInfo().ShowContextMenu().ShowPropertiesDlg().ShowProcessDlg();
link <<= true;
OnLink();
link.WhenAction = THISBACK(OnLink);
}
void Tab12_Linked::OnLink() {
if (link) {
scatter1.SetTitle("Plots are linked together");
scatter2.LinkedWith(scatter1);
scatter3.LinkedWith(scatter1);
} else {
scatter1.SetTitle("Plots are not linked now");
scatter2.Unlinked();
scatter3.Unlinked();
}
}
ScatterDemo *Construct12()
{
static Tab12_Linked tab;
return &tab;
}
INITBLOCK {
RegisterExample("Linked controls", Construct12, __FILE__);
}
tab2_Functions.cpp
#include "ScatterCtrl_Demo.h"
double funct1(double x) {return 3;}
double funct2(double x) {return (x*x-5);}
double funct3(double x) {return (-x*x-5);}
void vfunct1(double& y, double x) {y = 0;}
void vfunct2(double& y, double x) {y = x*x;}
void vfunct3(double& y, double x) {y = -x*x;}
double Tab2_Functions::MySource::Calc(double x) {return x + data/10;}
void Tab2_Functions::Init()
{
CtrlLayout(*this);
SizePos();
scatter.SetRange(12, 60).SetXYMin(-6, -30).SetMajorUnits(2, 10);
scatter.SetMouseHandling(true);
scatter.AddSeries(&funct1).Legend("y = 3").NoMark();
scatter.AddSeries(&funct2).Legend("y = x^2-5").NoMark();
scatter.AddSeries(&funct3).Legend("y = -x^2-5").NoMark();
scatter.AddSeries(&vfunct1).Legend("y = 0").NoMark();
scatter.AddSeries(&vfunct2).Legend("y = x^2").NoMark();
scatter.AddSeries(&vfunct3).Legend("y = -x^2").NoMark();
source.Init(23);
scatter.AddSeries(source).Legend("My source").NoMark();
}
ScatterDemo *Construct2()
{
static Tab2_Functions tab;
return &tab;
}
INITBLOCK {
RegisterExample("Explicit Functions", Construct2, __FILE__);
}
tab16_StackedPlot.cpp
#include "ScatterCtrl_Demo.h"
void TabStackedPlot::Init()
{
CtrlLayout(*this);
SizePos();
scatter.SetMouseHandling(true, true).ShowContextMenu().ShowPropertiesDlg().ShowProcessDlg();
for (int x = 0; x <= 10; ++x) {
s1 << Pointf(x, Random(50));
s2 << Pointf(x, Random(50));
s3 << Pointf(x, Random(50));
}
ds1.Init(s1);
ds2.Init(s2);
ds3.Init(s3);
stacked.Add(ds1).Add(ds2).Add(ds3);
scatter.AddSeries(stacked.Get(2)).Legend("s3").Fill();
scatter.AddSeries(stacked.Get(1)).Legend("s2").Fill();
scatter.AddSeries(stacked.Get(0)).Legend("s1").Fill();
scatter.SetLabelY("Data").SetLabelX("time [seg]")
.ShowButtons().Responsive();
type = 0;
type.WhenAction = THISBACK(OnPlot);
OnPlot();
}
void TabStackedPlot::OnPlot()
{
stacked.Set100(type == 1);
scatter.ZoomToFit(true, type != 1, 0.2);
if (type == 1) {
scatter.SetXYMin(-2, -10);
scatter.SetRange(14, 120);
scatter.SetMajorUnits(2, 10);
scatter.SetMinUnits(-2, -10);
} else {
scatter.SetXYMin(-2, Null);
scatter.SetRange(14, Null);
scatter.SetMajorUnits(2, Null);
scatter.SetMinUnits(-2, Null);
}
}
ScatterDemo *Construct16()
{
static TabStackedPlot tab;
return &tab;
}
INITBLOCK {
RegisterExample("StackedPlot", Construct16, __FILE__);
}
tab18_UserPaint.cpp
#include "ScatterCtrl_Demo.h"
void Tab_UserPaint::Init()
{
CtrlLayout(*this);
SizePos();
double a = 1, b = 0, c = 1;
for (double x = -6; x < 6; x += 0.1)
s1 << Pointf(x, a*exp(-sqr(x - b)/(2*c*c)));
scatter.AddSeries(s1).Legend("Gauss").Opacity(0.3).Fill().NoMark();
scatter.ShowInfo().ShowContextMenu().ShowPropertiesDlg().ShowProcessDlg().
SetMouseHandling(true, true);
scatter.SetLegendPos(Point(20, 20)).SetLegendAnchor(ScatterDraw::RIGHT_BOTTOM);
scatter.Rotate(ScatterCtrl::Angle_0);
scatter.ZoomToFit(true, true);
scatter.WhenPainter = THISBACK(OnPainter);
scatter.WhenDraw = THISBACK(OnDraw);
}
ScatterDemo *Construct18()
{
static Tab_UserPaint tab;
return &tab;
}
INITBLOCK {
RegisterExample("User paint", Construct18, __FILE__);
}
tab5_Dynamic.cpp
#include "ScatterCtrl_Demo.h"
void Tab5_Dynamic::Init()
{
CtrlLayout(*this);
SizePos();
scatter.SetRange(10, 100);
scatter.AddSeries(s1).Legend("U-t").Units("V", "s").NoMark();
scatter.AddSeries(s2).Legend("I-t").Units("A", "s").NoMark();
scatter.SetFastViewX(true).SetSequentialXAll(true);
bStart <<=(THISBACK(Start));
bStop <<=(THISBACK(Stop));
bReset <<=(THISBACK(Reset));
bPgDown <<=(THISBACK(PgDown));
bPgUp <<=(THISBACK(PgUp));
bPlus <<=(THISBACK(Plus));
bMinus <<=(THISBACK(Minus));
t = 0;
bStop.Disable();
}
void Tab5_Dynamic::Animate()
{
s1 << Pointf(t, 50+20*sin(t));
s2 << Pointf(t, 50+30*cos(t));
scatter.Refresh();
t += 0.1;
if((t-scatter.GetXMin()) >= scatter.GetXRange())
scatter.SetXYMin(scatter.GetXMin() + 0.1, 0);
}
void Tab5_Dynamic::Start()
{
SetTimeCallback(-5, THISBACK(Animate));
bStart.Disable();
bStop.Enable();
}
void Tab5_Dynamic::Stop()
{
KillTimeCallback();
bStart.Enable();
bStop.Disable();
}
void Tab5_Dynamic::Reset()
{
t = 0;
s1.Clear();
s2.Clear();
scatter.SetXYMin(0, 0);
scatter.Refresh();
}
void Tab5_Dynamic::PgDown()
{
scatter.SetXYMin(scatter.GetXMin()-5, 0);
scatter.Refresh();
}
void Tab5_Dynamic::PgUp()
{
scatter.SetXYMin(scatter.GetXMin()+5, 0);
scatter.Refresh();
}
void Tab5_Dynamic::Plus()
{
scatter.SetRange(scatter.GetXRange()/2, 100);
scatter.Refresh();
}
void Tab5_Dynamic::Minus()
{
scatter.SetRange(scatter.GetXRange()*2, 100);
scatter.Refresh();
}
ScatterDemo *Construct5()
{
static Tab5_Dynamic tab;
return &tab;
}
INITBLOCK {
RegisterExample("Dynamic", Construct5, __FILE__);
}
tab10_User.cpp
#include "ScatterCtrl_Demo.h"
#define IMAGECLASS Symbol
#define IMAGEFILE <ScatterCtrl_Demo/symbol.iml>
#include <Draw/iml.h>
class MyPlot : public SeriesPlot {
private:
template <class T>
void DoPaint(T& w, const double &scale, Vector<Pointf> &p, const double opacity,
double thick, const Color &color, String pattern, const Color &background,
const Color &fillColor, double y0) const {
Vector<Pointf> t;
t.SetCount(3);
for (int i = 0; i < p.GetCount(); ++i) {
t[0].x = p[i].x + 80;
t[0].y = y0;
t[1] = p[i];
t[2].x = p[i].x - 80;
t[2].y = y0;
if (!IsNull(fillColor))
FillPolylineOpa(w, t, scale, opacity, background, fillColor);
DrawPolylineOpa(w, t, scale, 1, thick, color, pattern, background);
}
}
public:
void Paint(Draw& w, Vector<Pointf> &p, const double &scale, const double opacity,
double thick, const Color &color, String pattern, const Color &background,
const Color &fillColor, double fx, double fy, double y0, double width,
bool isClosed) const {
DoPaint(w, scale, p, opacity, fround(thick), color, pattern, background, fillColor, y0);
}
void Paint(Painter& w, Vector<Pointf> &p, const double &scale, const double opacity,
double thick, const Color &color, String pattern, const Color &background,
const Color &fillColor, double fx, double fy, double y0, double width,
bool isClosed) const {
DoPaint(w, scale, p, opacity, fround(thick), color, pattern, background, fillColor, y0);
}
};
class MyMark : public MarkPlot {
private:
template <class T>
void DoPaint(T& w, const double& scale, const Point& cp, const double& size, const Color& markColor) const {
Size bugSize = Symbol::bug().GetSize()*scale;
w.DrawImage(cp.x - bugSize.cx/2, cp.y - bugSize.cy/2, bugSize.cx, bugSize.cy, Symbol::bug());
}
public:
void Paint(Draw &p, const double& scale, const Point& cp, const double& size, const Color& markColor,
const double&, const Color&) const {
DoPaint(p, scale, cp, size, markColor);
}
void Paint(Painter &p, const double& scale, const Point& cp, const double& size, const Color& markColor,
const double&, const Color&) const {
DoPaint(p, scale, cp, size, markColor);
}
};
void Tab10_User::Init()
{
CtrlLayout(*this);
SizePos();
sy[0] = 18; sy[1] = 29; sy[2] = 23; sy[3] = 25; sy[4] = 20;
sx[0] = 10; sx[1] = 20; sx[2] = 30; sx[3] = 40; sx[4] = 50;
scatter.AddSeries(sx, sy, 5).Legend("Series").PlotStyle<MyPlot>().MarkStyle<MyMark>()
.Stroke(3, LtGreen()).Fill(LtGray());
scatter.SetRange(60, 50).SetMajorUnits(10, 10);
scatter.ShowInfo().ShowContextMenu().ShowPropertiesDlg().ShowProcessDlg().Responsive();
}
ScatterDemo *Construct10()
{
static Tab10_User tab;
return &tab;
}
INITBLOCK {
RegisterExample("User graph", Construct10, __FILE__);
SeriesPlot::Register<MyPlot>("My plot");
MarkPlot::Register<MyMark>("My mark");
}
tab8_Secondary.cpp
#include "ScatterCtrl_Demo.h"
void Tab8_Secondary::Init()
{
CtrlLayout(*this);
SizePos();
scatter.SetRange(13, 50, 20).SetMajorUnits(1, 10).SetXYMin(0,-20, 1000);
scatter.SetMouseHandling(true, true);
s3 <<Pointf(1,-12)<<Pointf(2,-17)<<Pointf(3,-13)<<Pointf(4,15)<<Pointf(5,18)<<Pointf(6,25)<<Pointf(7,27)<<Pointf(8,20)<<Pointf(9,5)<<Pointf(10,-10)<<Pointf(11,24)<<Pointf(12,17);
double barWidth = 0.4;
scatter.AddSeries(s3).Legend("Speed").Units("km/h").PlotStyle<BarSeriesPlot>().BarWidth(barWidth).NoMark().Stroke(2, Gray()).Dash(LINE_SOLID).Fill(LtGray());
s1<<Pointf(1,-6)<<Pointf(2,-4)<<Pointf(3,2)<<Pointf(4,8)<<Pointf(5,8)<<Pointf(6,15)<<Pointf(7,20)<<Pointf(8,30)<<Pointf(9,14)<<Pointf(10,10)<<Pointf(11,3)<<Pointf(12,-11);
scatter.AddSeries(s1).Legend("Temperature").ERROR: Invalid UTF-8 sequence: şC`"`)[@B `.]Stroke`
|