|
class Scatter : public StaticRect
A class to plot 2D graphs.
void FitToData(bool Y = false)
Changes X axis zoom to fit visible all data in Ctrl.
If Y is true, Y axis zoom is also changed to fit the data.
void SaveToClipboard(bool saveAsMetafile = false)
Saves graph to clipboard as a bitmap.
In windows if saveAsMetafile is true, a metafile is sent to clipboard.
void SaveToImage(String fileName = Null)
Saves graph to file fileName. Supported formats are .PNG and .JPG.
If fileName is null, a window is opened asking the user to enter a file name.
Scatter& SetFastViewX(bool set = true)
If set is true, it will be viewed a point per horizontal pixel. This point will be the average of all data that is in that pixel.
This speeds up the graph painting.
Font& GetTitleFont()
Returns title font.
double GetXByPoint(const int x)
Gets the X coordinate in data units from value x in screen pixels inside Ctrl.
double GetYByPoint(const int y)
Gets the Y coordinate in data units from value y in screen pixels inside Ctrl.
double GetY2ByPoint(const int y)
Gets the Y2 coordinate in data units from value y in screen pixels inside Ctrl.
double GetXPointByValue(const double x)
Gets the horizontal position in pixels inside Ctrl for a value x in data units.
double GetYPointByValue(const double y)
Gets the vertical position in pixels inside Ctrl for a value y in data units.
Scatter& ShowInfo(bool show=true)
Defines to show or not with show the pop-up window that indicates in data units the cursor location and, if dragged, the size of the window.
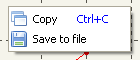
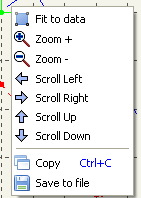
Scatter& ShowContextMenu(const bool& show=true)
Defines to show or not with show the context menu with options to save the plot to clipboard or file. Formats supported are .PNG and .JPG

If SetMouseHandling() is true in X and/or Y axis, scroll and zoom are also included.
void FitToData(bool Y = false)
Scales and scrolls the plots so that all data is included in X axis. If Y is true, Y axis is also fitted so that all plot points are visible.
void Zoom(double scale, bool hor = true, bool ver = true)
Zooms graph by scale factor. The axis scaled are X if hor is true and Y if ver is true.
void Scroll(double factorX, double factorY)
Scrolls graph by factorX in X axis and factorY in Y axis.
Scatter& SetMouseHandling(bool valx = true, bool valy = false)
Activates plot scrolling and zoom in X axis if valx is true and in Y axis if valy is true.
Scatter& SetRange(double rx, double ry, double ry2 = -1)
Sets visible data range for X axis in rx, Y axis in ry and secondary Y axis in ry2.
double GetXRange()const
Gets X axis visible data range.
double GetYRange()const
Gets Y axis visible data range.
double GetY2Range()const
Gets secondary Y axis visible data range.
Scatter& SetMajorUnits(double ux, double uy)
Sets the space between grid lines, horizontal grid in ux and vertical grid in uy.
double GetMajorUnitsX()
Gets the space between horizontal grid lines.
double GetMajorUnitsY()
Gets the space between vertical grid lines.
Scatter& SetMinUnits(double ux, double uy)
Sets the distance from the leftmost vertical grid to origin (ux) and from bottommost horizontal grid to origin (uy).
Scatter& SetXYMin(double xmin,double ymin,double ymin2 = 0)
Sets the coordinate of the first visible point in the leftmost, bottommost corner of control in X axis coordinates as xmin, Y axis coordinates as ymin and secondary Y axis coordinates as ymin2.
double GetXMin () const
Gets X axis coordinate of the first visible point in the leftmost side of control.
double GetYMin () const
Gets Y axis coordinate of the first visible point in the bottommost side of control.
double GetYMin2 () const
Gets secondary Y axis coordinate of the first visible point in the bottommost side of control.
void SetPopText(const String x, const String y, const String y2)
Sets the text that will define the values in axis x, y and y2.
It is used in the pop text that appears when selecting a point or a window.
Scatter &AddSeries(Vector<XY> & points,const String& legend="", const bool& join=false,const class::Color& pcolor=LtBlue,const int& width=30,const int& thickness=6)
Adds a new data series located in points, with legend.
Scatter &Stroke(int width = 30, class::Color color = Null, const String pattern = LINE_SOLID)
Sets the line width, color and line pattern of the latest added series.
If color is Null, it is selected automatically a different color depending of the series id.
Available pattern values are:
LINE_DOTTED "o..."
LINE_DOTTED_SEP "o..........."
LINE_DASHED "oooooo......"
LINE_DASH_DOT "ooooo...o..."
LINE_SOLID "oooooooooooo"
However this value is user configurable just entering a String with the pattern defining line elements as "o" and space elements as ".".
Scatter &Mark(int thickness = 6, class::Color color = Null, MarkStyle style = CIRCLE)
Sets the mark thickness, color and style of the latest added series.
If color is Null, it is selected automatically a different color depending of the series id.
Available mark style values are CIRCLE, RECTANGLE, SQUARE, TRIANGLE, CROSS, X, RHOMB.
Scatter &HideMark()
Hides the of the latest added series.marks.
void SetSequentialX(const int& j, const bool& sequential = true)
If sequential is true, it Indicates that the j graph data has been sequentially inserted following X axis.
This speeds up the graph painting.
Scatter &SetSequentialX(const bool& sequential = true)
If sequential is true, it Indicates that the last inserted graph data has been sequentially inserted following X axis.
This speeds up the graph painting.
Scatter &SetSequentialXAll(const bool& sequential = true)
If sequential is true, it Indicates that all graph data has been sequentially inserted following X axis.
This speeds up the graph painting.
void RemoveSeries(const int& j)
Remove j data series.
void RemoveAllSeries()
Remove all data series, cleaning the graph.
bool SetMouseBehavior(MouseBehaviour *mouseBehavior)
Sets with mouseBehavior the array of MouseBehavior conditions and actions to be considered when handling the mouse over the control.
This array has to be ended with an item with action == NO_ACTION.
Returns false if mouseBehavior array is not well defined.
struct MouseBehavior
This structure is used to describe the behavior of the mouse when used in Scatter. It includes the keyboard and mouse conditions that, when complied, will launch the indicated action.
It is used by SetMouseBehavior(MouseBehaviour *_mouseBehavior) function to set an array of MouseBehavior items that will be used to launch actions as zooming or scrolling when mouse is used.
The default array is in Scatter::MouseBehaviour defaultMouse.
bool ctrl
Set to true if Ctrl has to be pressed.
bool alt
Set to true if Alt has to be pressed.
bool shift
Set to true if Shift has to be pressed.
bool left
Set to true if mouse left button has to be pressed.
bool middle
Set to true if mouse middle button has to be pressed.
int middleWheel
Set to true if mouse middle wheel has to be rolled.
bool right
Set to true if mouse right button has to be pressed.
MouseAction action
Is the action to be launched if the previous conditions are complied. It can be:
NO_ACTION No action. It serves to mark the end of MouseBehavior array.
SCROLL Scrolls the graphs.
ZOOM_H_ENL Zooms horizontally enlarging the graphs.
ZOOM_H_RED Zooms horizontally reducing the graphs.
ZOOM_V_ENL Zooms vertically enlarging the graphs.
ZOOM_V_RED Zooms horizontally reducing the graphs.
SHOW_INFO Shows an info label including mouse real X and Y coordinates.
|