Home » U++ Library support » Draw, Display, Images, Bitmaps, Icons » ScatterDraw/ScatterCtrl new features
| ScatterDraw/ScatterCtrl new features [message #39821] |
Sat, 04 May 2013 02:19  |
 |
 koldo
koldo
Messages: 3459
Registered: August 2008
|
Senior Veteran |
|
|
Hello all
ScatterDraw/ScatterCtrl classes have some new features:
- Trend lines
They can be handled outside Scatter classes by using ExplicitEquation class. This class can fit your data to any equation supplied.
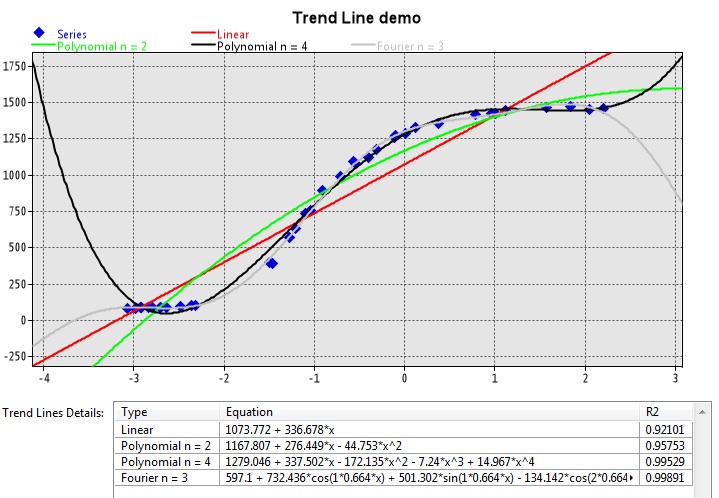
It is incredibly simple to use 
- Properties window
Scatter properties window is activated by clicking right mouse button and choosing "Properties". It lets you change some properties and copy selected plot data to clipboard. It is activated by default in DEBUG mode or by ShowPropertiesDlg().
- PieChart
Andrei Catalin pie chart from Bazaar/Scatter has been moved here with some changes. It is experimental pending to be implemented in Painter.
-
 Attachment: trend.jpg
(Size: 111.66KB, Downloaded 1099 times)
Best regards
Iñaki
[Updated on: Sat, 04 May 2013 02:22] Report message to a moderator |
|
|
|
|
|
|
|
|
|
|
|
|
|
| Re: ScatterDraw/ScatterCtrl new features [message #39876 is a reply to message #39870] |
Wed, 08 May 2013 23:51  |
Didier
Messages: 740
Registered: November 2008
Location: France
|
Contributor |
|
|
Hi Koldo,
I detected a small compilation issue that occurs on some compilers (gcc for arm for example).
In ScatterDraw/Equation.cpp, replace:
struct Equation_functor : NonLinearOptimizationFunctor<double> {
	DataSource *series;
	ExplicitEquation *fSource;
    Equation_functor() : NonLinearOptimizationFunctor() {}
by
struct Equation_functor : NonLinearOptimizationFunctor<double> {
	DataSource *series;
	ExplicitEquation *fSource;
    Equation_functor() : NonLinearOptimizationFunctor<double>() {}   --- correction here ---
Add <double> to the base class default constructor (or remove the call since it's the defaut constructor)
[Updated on: Wed, 08 May 2013 23:53] Report message to a moderator |
|
|
|
| Re: ScatterDraw/ScatterCtrl new features [message #39877 is a reply to message #39870] |
Thu, 09 May 2013 07:17 |
|
|
| BioBytes wrote on Wed, 08 May 2013 17:56 |
I have another question: What is the difference with PlotCtrl/PlotLib ?
|
Hi Biobytes,
PlotLib and PlotCtrl was my experiment to create a graphing based on Painter (as there was none at that time). It is not developped anymore as it was by far surpassed by the graphing widgets from Koldo and Didier. The only last feature where PlotLib might have advantage is that it can be used for drawing in non-GUI apps (event on servers with no X windows installed), as it doesn't use CtrlCore.
But as I said, it is not developed anymore, and it is probably full of bugs I wouldn't recommend using it for production code, unless you really need some of the special functionality and you're willing to spend considerable time developing it to suit your needs. Actually I think it might be better if I delete it from svn, so it doesn't confuse people
Honza
|
|
|
|
|
|
|
|
|
|
Goto Forum:
Current Time: Tue May 26 05:08:20 GMT+2 2026
Total time taken to generate the page: 0.00604 seconds
|
 U++ framework


