|
|
|
Home » U++ TheIDE » U++ TheIDE: Other Features Wishlist and/or Bugs » [FEATURE REQUEST]Can we support more chart types?
| [FEATURE REQUEST]Can we support more chart types? [message #40987] |
Fri, 18 October 2013 07:11  |
 woielakp
Messages: 3
Registered: October 2013
|
Junior Member |
|
|
Hello,
I'm working on the design of an algo-trading monitor,and I need a plotting library which can make financial charts( OHLC,candlestick [both static and dynamic plotting support] ) and statistical charts ( histogram charts ,etc ).
Bazzar/Scatter is not enough.
I've tried "ChartDirect" "PLPlot" before I meet U++,and I do not know how to make a wrapper of them with Upp::Ctrl.
So here comes 2 solutions:
1.Enrich Scatter (now maybe ScatterCtrl & ScatterPlot library) to support more chart types
2.Include external plotting libraries to Upp.
I'm looking forward to your advices.Thanks.
|
|
|
|
|
|
|
|
|
|
| Re: [FEATURE REQUEST]Can we support more chart types? [message #40998 is a reply to message #40996] |
Fri, 18 October 2013 20:09  |
Didier
Messages: 740
Registered: November 2008
Location: France
|
Contributor |
|
|
Hi qsoft,
There is also another graph package which has all the graphing possibilities of ScatterDraw since it uses it's series class.
GraphDraw & GrahCtrl (it is in svn sandbox : svn://www.ultimatepp.org/upp/sandbox )
The main difference is that GraphDraw end GraphCtrl are built to be enhanced:
- add specific axis management ( drawing, scaling, PropertiesDlg... )
- add custom data over the plot ( exlusion zones for example)
- Legend can be moved around and re-sized on the graph
- add specific legend ( whatever you wan't )
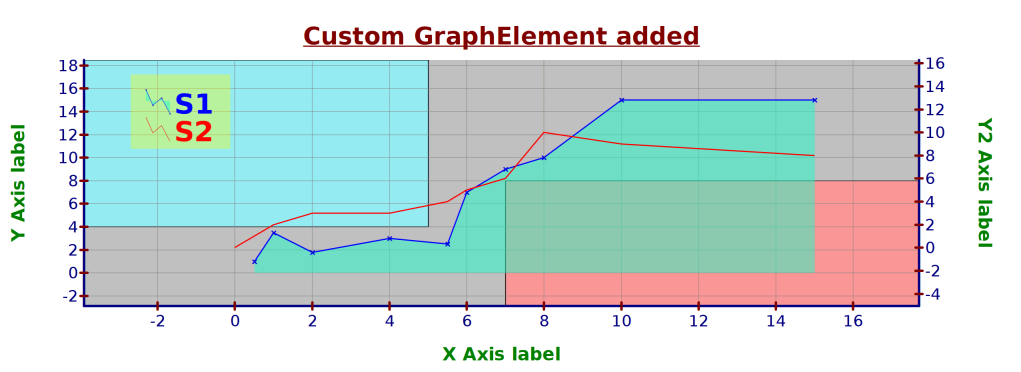
- In general add any sort of 'element' to the graph
It also has some other capacities that ScatterCtrl does not have :
- Undo/Redo
- native support of any number of axis (with individual/global move/zoom/FitToData )
- plot image is cashed ==> the purpose is to avoid redraw when not necessary (if you have several charts with huge data on several tabs for instance .... you will appreciate this feature
- fast draw : works by doing decimation of the data ==> the global shape/distribution of the data is kipped when moving/zooming the plot
This means you can achieve virtually any chart you need
The main drawback are the following:
- no documentation yet (I'recently started filling up the gap slowly)
- Complex code for the moment ( this is du to the use of a long inheritance tree that uses CRTP : the aim of this is to postpone some decisions the latter possible and when all is OK ==> kick out what's not needed ... so great simplification )
The following example shows a basic example of exclusion zones
[Updated on: Fri, 18 October 2013 20:22] Report message to a moderator |
|
|
|
|
|
|
|
|
|
|
|
|
|
Goto Forum:
Current Time: Sat Mar 07 07:08:29 CET 2026
Total time taken to generate the page: 0.30293 seconds
|
|
|


 Members
 Pages
Pages Help
Help Register
 Login
Login Home
Home


")
