Overview
Examples
Screenshots
Comparisons
Applications
Download
Documentation
Tutorials
Bazaar
Status & Roadmap
FAQ
Authors & License
Forums
Funding Ultimate++
Search on this site
Search in forums


SourceForge.net Logo
Home » Community » Newbie corner » How do I make this graph?
How do I make this graph? [message #39823] Sat, 04 May 2013 09:51 Go to next message
jerson is currently offline  jerson
Messages: 202
Registered: June 2010
Location: Bombay, India
Experienced Member

I've been trying my hand using the scatter control to achieve something like this.
index.php?t=getfile&id=4163&private=0

This is a user control I had built in Visual Basic. Is it possible to get a similar graph using the scatter control or any widget already present in U++?

Regards
Jerson
  • Attachment: CropImage.jpg
    (Size: 17.07KB, Downloaded 624 times)
Re: How do I make this graph? [message #39827 is a reply to message #39823] Sat, 04 May 2013 15:22 Go to previous messageGo to next message
Didier is currently offline  Didier
Messages: 680
Registered: November 2008
Location: France
Contributor
Hi Jerson,

Is this what you are trying to do ?

index.php?t=getfile&id=4165&private=0
  • Attachment: GC_test.png
    (Size: 9.16KB, Downloaded 595 times)

[Updated on: Sat, 04 May 2013 15:22]

Report message to a moderator

Re: How do I make this graph? [message #39828 is a reply to message #39827] Sat, 04 May 2013 15:26 Go to previous messageGo to next message
Didier is currently offline  Didier
Messages: 680
Registered: November 2008
Location: France
Contributor
If this the case than you can use the following example as starting point.

This example uses GraphCtrl and GraphDraw (they are in svn sandbox)

If the X axis layout does not fit you're needs then you can build you're own layout quite easily
Re: How do I make this graph? [message #39829 is a reply to message #39828] Sat, 04 May 2013 16:53 Go to previous messageGo to next message
jerson is currently offline  jerson
Messages: 202
Registered: June 2010
Location: Bombay, India
Experienced Member

Didier

Thank you for your response. What I am trying to do is like this graph sample here.
index.php?t=getfile&id=4167&private=0

What you see in the graph are
1 - there are upto 4 series in the graph(this graph shows 3 series)
2 - The Y axis is linear and goes from +120 at the min position(Bot+Left) and -10db at the max position (Top+Left)
3 - X axis has only 13 points max, but the point legends are decided by me as you can see.
4 - Each series has a plot symbol

I would like to use any pre-existing widget as far as possible so I am looking for hints.

Thank you
PS: My current version is the last stable release 5485
  • Attachment: CropImage.jpg
    (Size: 13.40KB, Downloaded 567 times)

[Updated on: Sat, 04 May 2013 17:58]

Report message to a moderator

Re: How do I make this graph? [message #39835 is a reply to message #39829] Sun, 05 May 2013 15:57 Go to previous messageGo to next message
koldo is currently offline  koldo
Messages: 3355
Registered: August 2008
Senior Veteran
Hello Jerson

I imagine the X and Y axis are rather "custom" so I propose you this to have exactly what you want:

index.php?t=getfile&id=4169&private=0

This is the code:

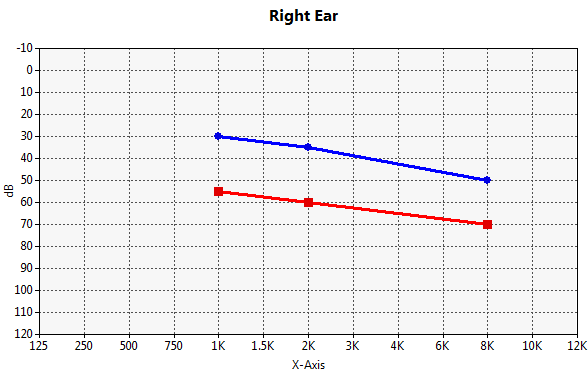
void MyClass::Init() {
	CtrlLayout(*this);	
	HSizePos().VSizePos();
	
	scatter.SetRange(12, 130);
	scatter.SetXYMin(0, -120);
	scatter.SetMajorUnits(1, 10);
	scatter.ShowLegend(false);
	scatter.SetTitle("Right Ear").SetLabelX("X-Axis").SetLabelY("dB");
	scatter.SetPlotAreaLeftMargin(40).SetPlotAreaBottomMargin(40);
	
	s1 <<Pointf(4, -30) << Pointf(6, -35) << Pointf(10, -50);
	s2 <<Pointf(4, -55) << Pointf(6, -60) << Pointf(10, -70);
	
	scatter.AddSeries(s1);
	scatter.AddSeries(s2);
	
	scatter.cbModifFormatX = THISBACK(FormatX);
	scatter.cbModifFormatY = THISBACK(FormatY);
}

void MyClass::FormatX(String& s, int i, double d) {
	Vector<String> xLegend;
	xLegend << "125" << "250" << "500" << "750" << "1K" << "1.5K" << "2K" << "3K" << "4K" << "6K" << "8K" << "10K" << "12K";
	s = xLegend[i];
}

void MyClass::FormatY(String& s, int i, double d) {
	s = FormatDouble(-d, 0);
}


Have a nice Sunday! Smile
  • Attachment: Image.png
    (Size: 10.50KB, Downloaded 562 times)


Best regards
Iñaki
Re: How do I make this graph? [message #39837 is a reply to message #39835] Sun, 05 May 2013 17:07 Go to previous messageGo to next message
jerson is currently offline  jerson
Messages: 202
Registered: June 2010
Location: Bombay, India
Experienced Member

Hi Koldo

This is brilliant. Thank you so much.

Regards
Jerson
Re: How do I make this graph? [message #39839 is a reply to message #39837] Sun, 05 May 2013 18:42 Go to previous messageGo to next message
jerson is currently offline  jerson
Messages: 202
Registered: June 2010
Location: Bombay, India
Experienced Member

Hi Koldo

A small issue with the code; these functions are throwing compile errors with MinGW

SetPlotAreaLeftMargin(40)
SetPlotAreaBottomMargin(40)

I tried the code with the latest nightly build 6031 just to be sure.

Regards
Jerson
Re: How do I make this graph? [message #39840 is a reply to message #39839] Sun, 05 May 2013 19:02 Go to previous messageGo to next message
koldo is currently offline  koldo
Messages: 3355
Registered: August 2008
Senior Veteran
Hello Jerson

Please enclose the error messages. I cannot reproduce it.


Best regards
Iñaki
Re: How do I make this graph? [message #39845 is a reply to message #39840] Mon, 06 May 2013 09:32 Go to previous messageGo to next message
jerson is currently offline  jerson
Messages: 202
Registered: June 2010
Location: Bombay, India
Experienced Member

Hi Koldo

These are the errors I get
BLITZ: ScrHistory.cpp ScrSetup.cpp main.cpp ScrSaveRecord.cpp ScrAudiometry.cpp
In file included from C:/upp/out/MyApps/A2001_13/MINGW.Blitz.Gui.Main\$blitz.cpp:25:0:
C:\MyApps\A2001_13\ScrAudiometry.cpp: In member function 'void A2001_13::ScrAudiometry()':
C:\MyApps\A2001_13\ScrAudiometry.cpp:30:16: error: 'class Scatter' has no member named 'SetPlotAreaLeftMargin'
A2001_13: 5 file(s) built in (0:02.79), 559 msecs / file, duration = 2797 msecs, parallelization 0%


for this line of code
Test.scaRight.SetPlotAreaLeftMargin(40).SetPlotAreaBottomMargin(40);

Test is a topwindow class, scaRight is the scatter control.

Another related question. I noticed that the series symbols are pre-defined like CIRCLE, RECTANGLE, TRIANGLE etc. Can they be changed to some images from an IML file?

Regards
Jerson
Re: How do I make this graph? [message #39846 is a reply to message #39845] Mon, 06 May 2013 10:11 Go to previous messageGo to next message
koldo is currently offline  koldo
Messages: 3355
Registered: August 2008
Senior Veteran
Hello Jerson

The message:

Quote:

"... error: 'class Scatter' ..."


is strange for me as it should have to be either ScatterCtrl or ScatterDraw instead. Could you give me more details as the declaration?

To set images as symbols you can see examples/ScatterCtrl_demo, class tab10, class MyMark:

index.php?t=getfile&id=4171&private=0


  • Attachment: demo.jpg
    (Size: 34.22KB, Downloaded 544 times)


Best regards
Iñaki
Re: How do I make this graph? [message #39847 is a reply to message #39846] Mon, 06 May 2013 11:40 Go to previous messageGo to next message
jerson is currently offline  jerson
Messages: 202
Registered: June 2010
Location: Bombay, India
Experienced Member

Hello Koldo

You are right. I was using the Scatter package and not ScatterCtrl

This was the included package
c:/upp/Bazaar/scatter

I have now changed to using ScatterCtrl and the problem has gone away.

Thanks

Jerson
Re: How do I make this graph? [message #39848 is a reply to message #39847] Mon, 06 May 2013 12:07 Go to previous messageGo to next message
koldo is currently offline  koldo
Messages: 3355
Registered: August 2008
Senior Veteran
Excellent. Smile

Best regards
Iñaki
Re: How do I make this graph? [message #39882 is a reply to message #39823] Thu, 09 May 2013 08:19 Go to previous messageGo to next message
jerson is currently offline  jerson
Messages: 202
Registered: June 2010
Location: Bombay, India
Experienced Member

Thanks for all the help. I have been able to make a workable solution with the scatterctrl.

index.php?t=getfile&id=4180&private=0
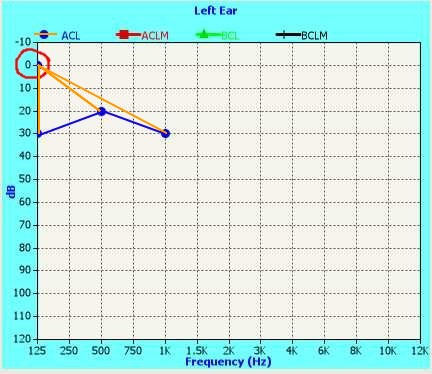
The blue line is what I wish to draw. It interpolates between data points that are presented to scatterctrl. However, the un-initialized vector data shows up at 0,0 This is not desirable because when I turn on .plot(), lines appear connecting 0,0 to each of the points in the series. It looks like cones falling from 0,0(orange lines)

I am setting the vector like this

Vector<Pointf> LeftSeries[4];

Since I have just 12 points on X axis, I enter the data like this
	Test.scaLeft.SetRange(12, 130).SetXYMin(0, -120);
	Test.scaLeft.SetMajorUnits(1, 10).ShowLegend(true);
	Test.scaLeft.SetLabelX("Frequency (Hz)").SetLabelY("dB");
	Test.scaLeft.cbModifFormatX = THISBACK(A2001_13::FormatX);
	Test.scaLeft.cbModifFormatY = THISBACK(A2001_13::FormatY);
	Test.scaLeft.AddSeries(LeftSeries[0]).Legend("ACL").NoPlot()
				.AddSeries(LeftSeries[1]).Legend("ACLM")
				.AddSeries(LeftSeries[2]).Legend("BCL")
				.AddSeries(LeftSeries[3]).Legend("BCLM");


and to plot the points
	double f = -1;
	
	Test.stText = AsString(Test.spnFrequency.GetIndex());
	LeftSeries[0].Set(Test.spnFrequency.GetIndex(), Pointf(Test.spnFrequency.GetIndex(),f*Test.spnIntensity));
	Test.scaLeft.Refresh();


Test is a <TopWindow>, others are EditIntSpin while spnFrequency is a droplist


The user can enter any point (not necessarily in a sequence of X) and the graph would interpolate it.

Question is, can this be done?

Best regards
Jerson
  • Attachment: CropImage.jpg
    (Size: 48.17KB, Downloaded 505 times)
Re: How do I make this graph? [message #39885 is a reply to message #39882] Thu, 09 May 2013 11:04 Go to previous messageGo to next message
koldo is currently offline  koldo
Messages: 3355
Registered: August 2008
Senior Veteran
Sorry Jerson

I do not understand you.

If you do not want to see a series that has uninitiated data you can use Show(index, false) to hide it temporarily.

As Scatter classes show scattered data, to see it ordered you should have to do a Sort() of the Vector using x axis as sorting criteria.


Best regards
Iñaki
Re: How do I make this graph? [message #39888 is a reply to message #39885] Thu, 09 May 2013 12:15 Go to previous messageGo to next message
jerson is currently offline  jerson
Messages: 202
Registered: June 2010
Location: Bombay, India
Experienced Member

Hi Koldo

Let me try saying it another way. For the moment, let me assume we talk of only one data series.

The series has points like this
vector    Point X    Point Y
Index     value        value
1           1           50
2          not yet filled in(uninitialised)
3          not yet filled in(uninitialised)
4          not yet filled in(uninitialised)
5          not yet filled in(uninitialised)
6           6           50
7          not yet filled in(uninitialised)
8          not yet filled in(uninitialised)
9           9           60
10         not yet filled in(uninitialised)
11         not yet filled in(uninitialised)
12         not yet filled in(uninitialised)


As the user conducts the test, more points in the table will get filled with X = index value and Y = reading.

What I wish to see is the line connecting only the values that are initialized with data(1-6-9). Right now, the unitialised points show their value at X=0,Y=0. Because of this, the graph shows the orange curve.

the reason for doing it via indexing is that the same point could be tested again. the number of points in the series will always be 12 (tested or not tested)

Thanks for looking at my problem

Regards
Jerson

[Updated on: Thu, 09 May 2013 12:18]

Report message to a moderator

Re: How do I make this graph? [message #39889 is a reply to message #39888] Thu, 09 May 2013 14:07 Go to previous messageGo to next message
jerson is currently offline  jerson
Messages: 202
Registered: June 2010
Location: Bombay, India
Experienced Member

I'd appreciate if anyone can show me an example of how to sort a vector of Pointf on member x.

Vector<Pointf> Series;

Re: How do I make this graph? [message #39890 is a reply to message #39889] Thu, 09 May 2013 14:36 Go to previous messageGo to next message
koldo is currently offline  koldo
Messages: 3355
Registered: August 2008
Senior Veteran
Hello Jerson

As I understand user goes adding new unsorted points. Every time the user does it you call Sort() and scatter.Refresh(). Only added points are drawn. To sort the Vector you can do this:

struct SortPointf {
	bool operator () (const Pointf& a, const Pointf& b) const { 
		return a.x < b.x
	}
};

....

Sort(series, SortPointf());


Best regards
Iñaki

[Updated on: Thu, 09 May 2013 14:37]

Report message to a moderator

Re: How do I make this graph? [message #39893 is a reply to message #39890] Thu, 09 May 2013 15:46 Go to previous messageGo to next message
jerson is currently offline  jerson
Messages: 202
Registered: June 2010
Location: Bombay, India
Experienced Member

Hi Koldo

Thanks, this is very close to what I want

How do I ensure that there is just one point at each X? Is there a function to find a point with x==index and replace that with a value?

What I am looking for is something like

if (Find(Series, Pointx.a==Index))
// replace the point
Series.Set(Index, PointNew);
else
// add to the series
Series << PointNew;

I'm sorry if this is very elementary. I haven't reached that far yet in C++.

Regards
Jerson
Re: How do I make this graph? [message #39894 is a reply to message #39893] Thu, 09 May 2013 16:03 Go to previous messageGo to next message
koldo is currently offline  koldo
Messages: 3355
Registered: August 2008
Senior Veteran
Hello Jerson

- The dummy solution: If the point is repeated they will overlap so only one will be seen
- The other: I would Sort() the Vector and Remove() by hand the repeated elements doing the for from the last to the first to avoid problems.


Best regards
Iñaki
Re: How do I make this graph? [message #39902 is a reply to message #39894] Fri, 10 May 2013 06:48 Go to previous messageGo to previous message
jerson is currently offline  jerson
Messages: 202
Registered: June 2010
Location: Bombay, India
Experienced Member

Hello Koldo

This is the final piece of code that does exactly what I want it to do. Please let me know if you would do the same differently.

void	A2001_13::Plot()
{
	double f = -1;
	int 	cnt;

	// First, if the point is already in the vector, remove it
	// Then add the point to the vector and
	// Sort it.
	for (cnt=0; cnt < 	LeftSeries[0].GetCount(); cnt++)
	{
		if (LeftSeries[0].At(cnt).x == Test.spnFrequency.GetIndex())
				LeftSeries[0].Remove(cnt,1);
	}
	LeftSeries[0] << Pointf(Test.spnFrequency.GetIndex(),f*Test.spnIntensity);
	Sort(LeftSeries[0],SortPointf());
	Test.scaLeft.Refresh();
}


The max points in vector is 12. Any point changed, gets updated.

Best Regards
Jerson
Previous Topic: MenuBar
Next Topic: SQL + vector related question
Goto Forum:


Current Time: Thu Mar 28 19:10:28 CET 2024

Total time taken to generate the page: 0.01829 seconds