|
|
|
Home » U++ Library support » ScatterDraw & ScatterCtrl » Entirely Null series is drawn as a random constant line
| Entirely Null series is drawn as a random constant line [message #56108] |
Wed, 27 January 2021 14:12  |
 Maginor
Messages: 44
Registered: May 2019
|
Member |
|
|
Hi,
If you plot a series consisting of only Null values, it draws a constant line from x = -inf to inf at a random constant y value.
I am using AddSeries(double *, double *, size_t)
Since the data I plot is user-controlled, I would like it to just not plot anything in this case (but probably still have it in the legend).
I could pre-check for it myself, but I think it would be good to have this behaviour corrected in the library.
|
|
|
|
|
|
| Re: Entirely Null series is drawn as a random constant line [message #56125 is a reply to message #56108] |
Fri, 29 January 2021 13:53  |
Maginor
Messages: 44
Registered: May 2019
|
Member |
|
|
That particular problem seems to have been fixed, but I have a new one:
When I draw lines and there are holes (Nulls) in the series, the holes are now filled with a line. I rely on the behaviour that this had before, where no lines are drawn between two values if there is a Null in between.
It also gets weirder, because if there is a hole at some point, values at later points where there are no holes sometimes also get janky.
I think this problem was not introduced now, but earlier last year (I have not updated upp since maybe January 2019) because another person who attempted to build my application with the upp distribution from some time in the autumn of 2020 reported this problem.
Examples:
Correct behaviour from the old version:
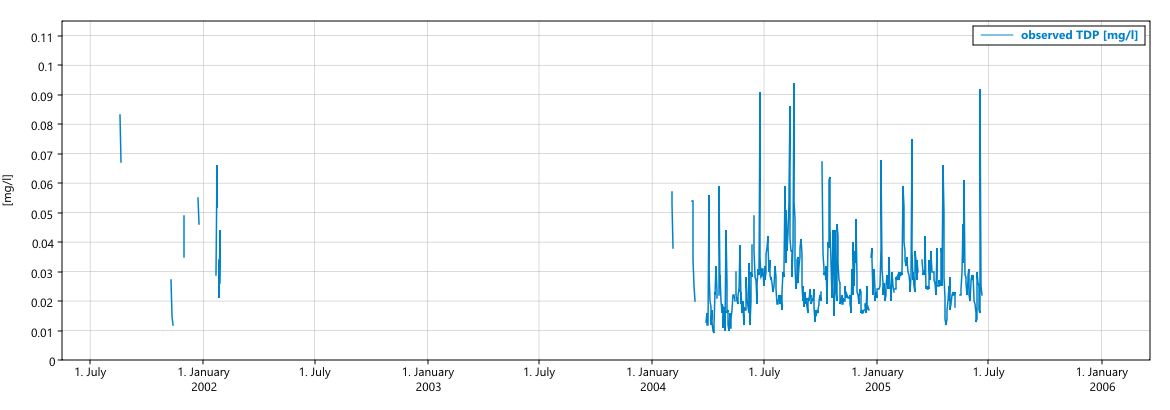
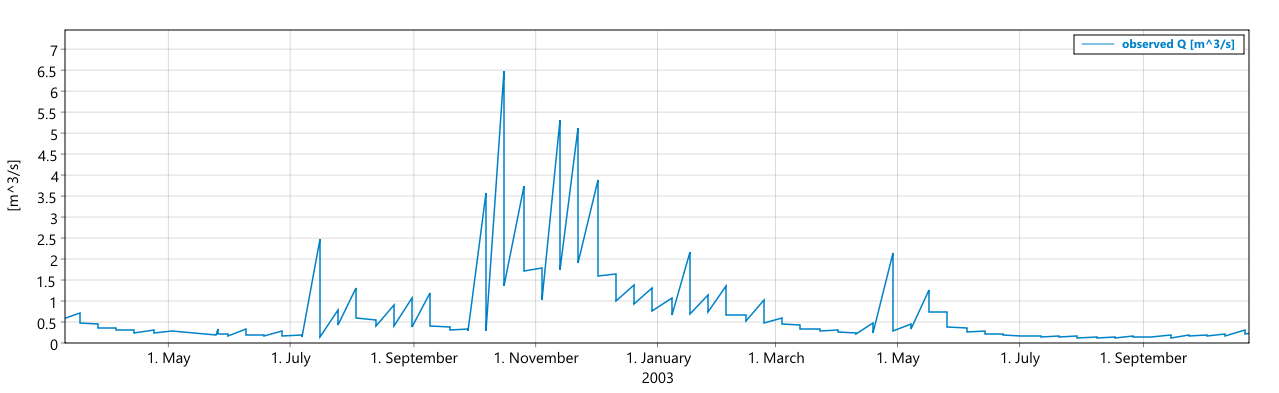
New behaviour on the same time series as above:
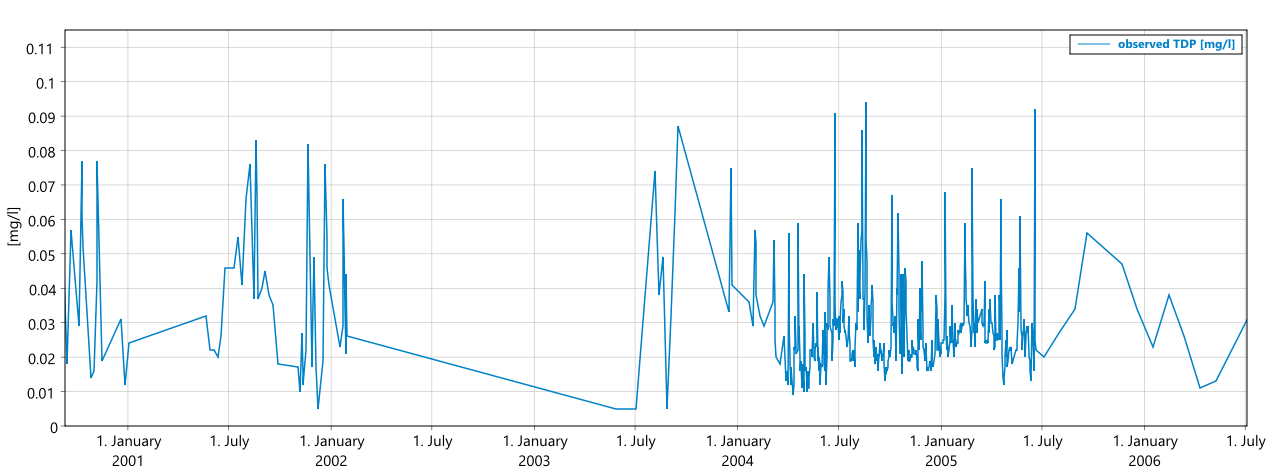
Correct behaviour from the old version:
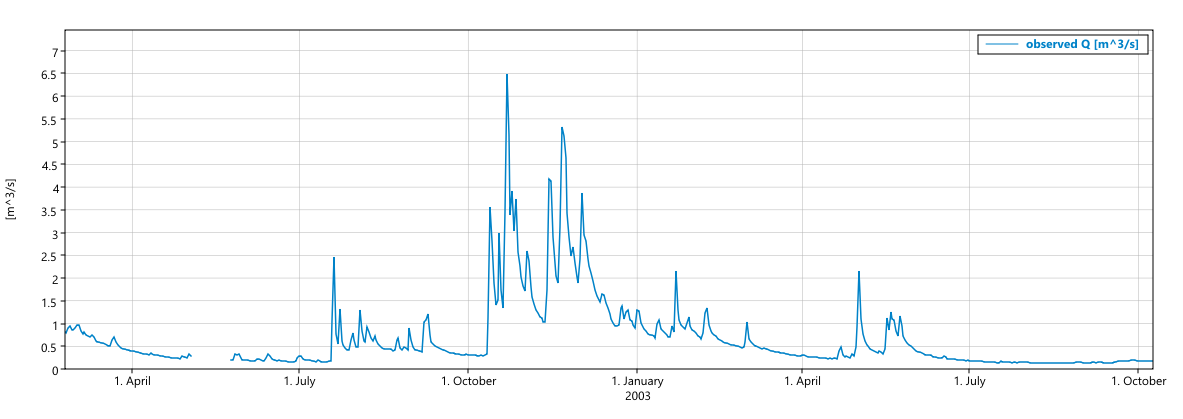
New behaviour on the same time series as above:
Edit:
I right clicked and looked at Scatter Data to confirm that the actual background data is the same in both versions, so the problem is with the plotting.
Edit:
I don't really understand the jankyness that is displayed in the second example. It may not be related to the hole issue at all. It seems like it begins happening at a random point in the time series. Some times that is at the beginning of the time series, other times it starts in the middle somewhere. However it seems like that if two series have the same set of X values, the jankiness tends to begin at the same X value for both.
What I call the "jankyness" here is that it puts two y values for each X value (which is not how the data are), and it skips points in between.
Note that I use pretty high X values (they are number of seconds since a reference date, and the series can go over many years). So if values are somehow rounded to float or something like that, maybe that could be an issue, but that is just random guessing.
These are all added using
AddSeries(double *, double *, int);
Note that I use
SetFastViewX(true);
SetSequentialXAll(true);
[Updated on: Fri, 29 January 2021 15:18] Report message to a moderator |
|
|
|
|
|
| Re: Entirely Null series is drawn as a random constant line [message #56140 is a reply to message #56135] |
Sun, 31 January 2021 14:37 |
Maginor
Messages: 44
Registered: May 2019
|
Member |
|
|
If you don't settle on having gaps in the line as a default, it would be very good to have it as an option. As I said, I rely on that in my application.
I have attached the data as a csv. Note that it is around 10'000 lines, and only the last 2/3 of the indexes have y-data in them. The ones that don't have any y-data should be given a y value of Null when you parse them.
You can parse it using something like the below (Sorry for not being upp idiomatic)
std::vector<double> xs, ys;

std::ifstream infile("data.csv");

std::string line;

std::getline(infile, line); //ignore first line

while (std::getline(infile, line))
{
    std::istringstream iss(line);
    double x, y;
    char c;
    if (iss >> x)
    { xs.push_back(x); }
    else break;
    iss >> c;   //eat the semicolon
    if(iss >> y)
    { ys.push_back(y); }
    else ys.push_back(Null);
}
infile.close();

Plot.AddSeries(xs.data(), ys.data(), xs.size());
-
 Attachment: data.csv
(Size: 205.04KB, Downloaded 145 times)
|
|
|
|
| Re: Entirely Null series is drawn as a random constant line [message #56153 is a reply to message #56140] |
Mon, 01 February 2021 11:21 |
 |
koldo
Messages: 3378
Registered: August 2008
|
Senior Veteran |
|
|
Hello Maginor
I have uploaded the changes. The Null, NaN, Inf values are not plotted so the scatter area with them is empty, although you have to consider these cases:
- SetFastViewX(false) (default), if either X or Y are Null, the area between adjacent points will not be plotted
- SetFastViewX(true), as it requires, for being faster, that X values are valid:
-- if Y is Null, the area between adjacent points will not be plotted
-- if X is Null, adjacent valid points will be joined
A demo about this is included in ScatterDraw_demo.
Best regards
Iñaki
|
|
|
|
| Re: Entirely Null series is drawn as a random constant line [message #56162 is a reply to message #56153] |
Tue, 02 February 2021 10:29 |
Maginor
Messages: 44
Registered: May 2019
|
Member |
|
|
Hi,
Thank you for that! The gaps in the line are correct now.
The other problem (where it draws 2 Y values for one X value, then skips 9 points and does the same thing again) still happens on the series I sent you.
When I right click the series to see the underlying data, the data is correct.
Only Y values can be Null, all X values are valid.
It only happens with SetFastViewX(true). The skipping of points for fast view is correct when it is zoomed out, but it still happens when I zoom in, and it skips multiple pixels.
The plotting tends to be fast enough with fast view off, so I can just do that for now.
[Updated on: Tue, 02 February 2021 10:30] Report message to a moderator |
|
|
|
|
|
|
|
| Re: Entirely Null series is drawn as a random constant line [message #56172 is a reply to message #56108] |
Wed, 03 February 2021 11:02 |
Maginor
Messages: 44
Registered: May 2019
|
Member |
|
|
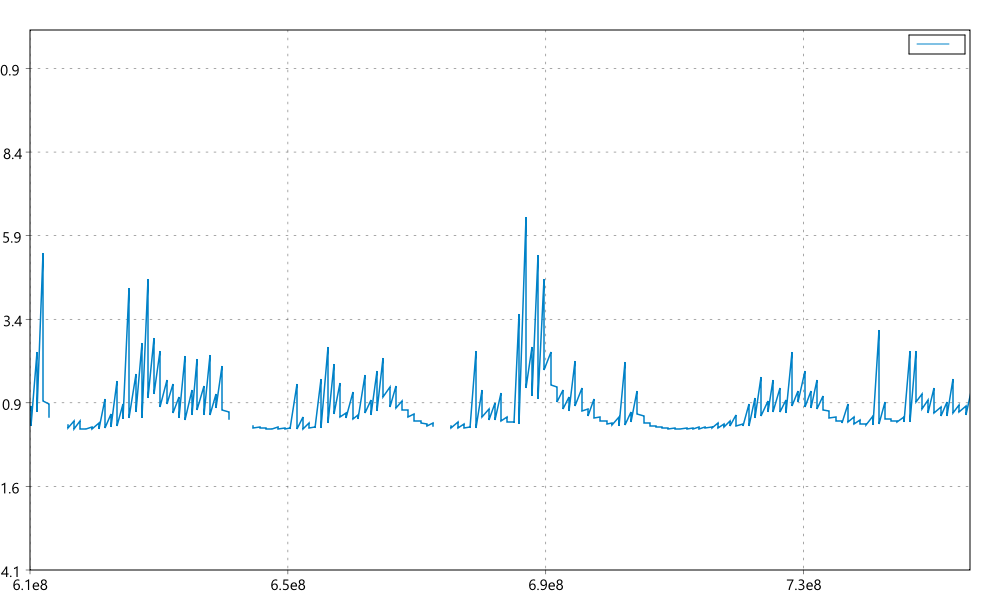
Hi, sorry. I did not want to post my main code here since it is pretty entangled. I did not have time to produce a separate bug reproduction before now:
The styling on the line is not essential.
Compiled using Clang64 on Windows.
Using the 2021-02-02 nightly build.
The image is what it looks like when you zoom in using the mouse wheel.
ScatterCtrlTest.lay:
LAYOUT(ScatterCtrlTestLayout, 916, 488)
	ITEM(Upp::ScatterCtrl, Plot, HSizePosZ(4, 4).VSizePosZ(4, 4))
END_LAYOUT
ScatterCtrlTest.h:
#ifndef _ScatterCtrlTest_ScatterCtrlTest_h
#define _ScatterCtrlTest_ScatterCtrlTest_h

#include <CtrlLib/CtrlLib.h>
#include <ScatterCtrl/ScatterCtrl.h>

using namespace Upp;

#define LAYOUTFILE <ScatterCtrlTest/ScatterCtrlTest.lay>
#include <CtrlCore/lay.h>

class ScatterCtrlTest : public WithScatterCtrlTestLayout<TopWindow> {
public:
	ScatterCtrlTest();

	std::vector<double> xs, ys;
};

#endif
ScatterCtrlTest.cpp:
#include "ScatterCtrlTest.h"

#include <fstream>

ScatterCtrlTest::ScatterCtrlTest()
{
	CtrlLayout(*this, "Window title");


	Plot.SetFastViewX(true);
	Plot.SetSequentialXAll(true);


	std::ifstream infile("data.csv");

	if(!infile) PromptOK("Failed opening file");

	std::string line;

	std::getline(infile, line); //ignore first line

	while (std::getline(infile, line))
	{
	    std::istringstream iss(line);
	    double x, y;
	    char c;
	    if (iss >> x)
	    { xs.push_back(x); }
	    else break;
	    iss >> c;   //eat the semicolon
	    if(iss >> y)
	    { ys.push_back(y); }
	    else ys.push_back(Null);
	}
	infile.close();

	Color GraphColor(0, 130, 200);
	Plot.AddSeries(xs.data(), ys.data(), xs.size()).NoMark().Stroke(1.5, GraphColor).Dash("");
	Plot.ZoomToFit();
	Plot.Refresh();
}

GUI_APP_MAIN
{
	ScatterCtrlTest().Run();
}
|
|
|
|
|
|
|
|
|
|
Goto Forum:
Current Time: Sat Jul 27 03:48:11 CEST 2024
Total time taken to generate the page: 0.01677 seconds
|
|
|


 Members
 Pages
Pages Help
Help Register
 Login
Login Home
Home


")
