|
|
|
Home » Developing U++ » UppHub » PlotCtrl
| PlotCtrl [message #22818] |
Wed, 19 August 2009 05:37  |
|
|
Hi,
I was looking around here for a simple way to plot mathematical functions, scientific data etc., but haven't found anything useful. Maybe I just wasn't looking hard enough  I remember I've seen here some package about a year ago, but couldn't find it now. Anyway, I decided to write my own widget for that. And because I read here about the Painter for quite some time I thought it might be good opportunity to learn bit more about it. I remember I've seen here some package about a year ago, but couldn't find it now. Anyway, I decided to write my own widget for that. And because I read here about the Painter for quite some time I thought it might be good opportunity to learn bit more about it.
In the attached file, you will find package containing simple, Painter based and hopefully easy to use class PlotCtrl. Simple example application and basic documentation are also included.
Main features of PlotCtrl are:
- Draws axes, including tics and labels
- Stores multiple independently configurable datasets
- Allows selection of line color and style
- Easy zooming using mouse
There are still some rough edges and I'm well aware it's not suitable for use in any serious application. So consider it alpha version please There is a bug in labeling algorithm, sometimes it falls into infinite loop, but it only happens on extreme zoom values. It is not very fast but after several minutes of physical computation few more milliseconds is nothing  I'm just warning you that it is definitely not meant for realtime or animation purposes. Although I tried to optimize it a little, for large datasets it still takes some time to redraw. I'm just warning you that it is definitely not meant for realtime or animation purposes. Although I tried to optimize it a little, for large datasets it still takes some time to redraw.
I've tried too keep the class interface as much in U++ style as possible but there is few design decision that differ a bit for the sake of simplicity. I apologize for that and also for my not really readable code. Hopefully it will not repel you from trying this package, I'm looking forward to your comments and suggestions.
Bye,
Honza
[EDIT: Removed the file, see newest version below.]
[Updated on: Sat, 22 August 2009 13:43] Report message to a moderator |
|
|
|
|
|
| Re: PlotCtrl [message #22822 is a reply to message #22820] |
Wed, 19 August 2009 18:30  |
|
|
Hi Koldo,
Thank you for trying it! I was aware of that freezing (and even mentioned it in the first post). As I found after posting, it happens when you reach the precision limit of double, specifically when x_max-x_min < ~1e-15 * x_max. Actually this will happen in most of the plotting code, if you zoom in region not containing (0,0). (I just checked gnuplot and it has this limitation too, just throws error about plotting into empty graph). I'll probably add similar check if I can't solve it in better way, it definitely should not freeze:-) Anyway, it should not be any problem in real-world usage, because one usually does not have data with details of order 1e-15 (relatively to the range, of course).
Concerning scatter: I've seen it some time ago... Today I checked the latest version and I must say it's a nice work. But with all the respect to Andrei-Catalin, it's not what I'm looking for. Or rather I'm missing there some features, like automatic handling of axis units, which you definitely need if you want zoom with mouse (which is not supported too, but that could be added easily). Also I've chosen Painter instead of Draw, to get antialiasing and nicer pictures, possibly suitable for print and/or publication.
And by the way, it has similar limit about zoom, it just does not freeze. If I understood the code correctly only scales from 1e-3 to 1e5 are fully supported. Physicist would have to wisely choose units to fit in this range or use some scaling. PlotCtrl, on the other hand, performs this scaling automatically and (as long as you stay near origin of coordinates) supports the whole range of double.
Regards,
Honza
|
|
|
|
| Re: PlotCtrl [message #22853 is a reply to message #22822] |
Sat, 22 August 2009 13:42 |
|
|
Hello everybody,
Here goes newest version of PlotCtrl. I've added checks to avoid freezes due to precision limitations (as described in above post). Another changes are in mouse handling - now it uses RectTracker - wonderful class, which I just discovered . Also the bindings are now (hopefully) more logical: left click zooms in, right click out, left push&move zooms to selection and ctrl+left shows all plots.
A lot of changes happened in the plotting code too. I've added clipping (drawing only segments of lines that are actually visible in current plot) and I was quite surprised by the speedup. Many thanks goes to Mirek, since it was his LineClip() from Painter, which I used as a base for my code to safe time I hope it's OK...
Things that still need to be fixed: axes labels, cursors and much more...
Any suggestions or feedback?
Regards,
Honza
[EDIT: Removed the file, see newest version below.]
[Updated on: Sat, 22 August 2009 20:22] Report message to a moderator |
|
|
|
| Re: PlotCtrl [message #22855 is a reply to message #22853] |
Sat, 22 August 2009 14:12 |
 gridem
Messages: 45
Registered: August 2008
|
Member |
|
|
I've tried to compile on MSC9 Win32:
----- PlotCtrl ( GUI NOGTK MSC9 DEBUG DEBUG_FULL BLITZ WIN32 MSC ) (2 / 11)
PlotCtrl.cpp
d:\MyApps\PlotCtrl\PlotCtrl.cpp(7) : error C2084: function 'double abs(double)' already has a body
        E:\Program Files\Microsoft Visual Studio 9.0\Vc\Include\math.h(487) : see previous definition of 'abs'
d:\MyApps\PlotCtrl\PlotCtrl.cpp(38) : warning C4244: '=' : conversion from 'double' to 'int', possible loss of data
d:\MyApps\PlotCtrl\PlotCtrl.cpp(127) : warning C4244: 'argument' : conversion from 'double' to 'int', possible loss of data
d:\MyApps\PlotCtrl\PlotCtrl.cpp(128) : warning C4244: 'argument' : conversion from 'double' to 'int', possible loss of data
d:\MyApps\PlotCtrl\PlotCtrl.cpp(133) : warning C4244: 'argument' : conversion from 'double' to 'int', possible loss of data
d:\MyApps\PlotCtrl\PlotCtrl.cpp(134) : warning C4244: 'argument' : conversion from 'double' to 'int', possible loss of data
d:\MyApps\PlotCtrl\PlotCtrl.cpp(138) : warning C4554: '&' : check operator precedence for possible error; use parentheses to clarify preceden
	ce
d:\MyApps\PlotCtrl\PlotCtrl.cpp(139) : warning C4554: '&' : check operator precedence for possible error; use parentheses to clarify preceden
	ce
d:\MyApps\PlotCtrl\PlotCtrl.cpp(140) : warning C4554: '&' : check operator precedence for possible error; use parentheses to clarify preceden
	ce
d:\MyApps\PlotCtrl\PlotCtrl.cpp(151) : error C2264: 'abs' : error in function definition or declaration; function not called
d:\MyApps\PlotCtrl\PlotCtrl.cpp(160) : warning C4244: 'argument' : conversion from 'double' to 'int', possible loss of data
d:\MyApps\PlotCtrl\PlotCtrl.cpp(165) : error C2264: 'abs' : error in function definition or declaration; function not called
d:\MyApps\PlotCtrl\PlotCtrl.cpp(174) : warning C4244: 'argument' : conversion from 'double' to 'int', possible loss of data
d:\MyApps\PlotCtrl\PlotCtrl.cpp(279) : warning C4244: 'argument' : conversion from 'double' to 'int', possible loss of data
d:\MyApps\PlotCtrl\PlotCtrl.cpp(279) : warning C4244: 'argument' : conversion from 'double' to 'int', possible loss of data
PlotCtrl: 1 file(s) built in (0:02.54), 2547 msecs / file, duration = 2578 msecs

There were errors. (0:18.20)
|
|
|
|
| Re: PlotCtrl [message #22856 is a reply to message #22853] |
Sat, 22 August 2009 14:27 |
gridem
Messages: 45
Registered: August 2008
|
Member |
|
|
I removed the 'abs' function and:
----- PlotCtrl ( GUI NOGTK MSC9 DEBUG DEBUG_FULL BLITZ WIN32 MSC ) (2 / 11)
PlotCtrl.cpp
d:\MyApps\PlotCtrl\PlotCtrl.cpp(38) : warning C4244: '=' : conversion from 'double' to 'int', possible loss of data
d:\MyApps\PlotCtrl\PlotCtrl.cpp(128) : warning C4244: 'argument' : conversion from 'double' to 'int', possible loss of data
d:\MyApps\PlotCtrl\PlotCtrl.cpp(129) : warning C4244: 'argument' : conversion from 'double' to 'int', possible loss of data
d:\MyApps\PlotCtrl\PlotCtrl.cpp(134) : warning C4244: 'argument' : conversion from 'double' to 'int', possible loss of data
d:\MyApps\PlotCtrl\PlotCtrl.cpp(135) : warning C4244: 'argument' : conversion from 'double' to 'int', possible loss of data
d:\MyApps\PlotCtrl\PlotCtrl.cpp(139) : warning C4554: '&' : check operator precedence for possible error; use parentheses to clarify preceden
	ce
d:\MyApps\PlotCtrl\PlotCtrl.cpp(140) : warning C4554: '&' : check operator precedence for possible error; use parentheses to clarify preceden
	ce
d:\MyApps\PlotCtrl\PlotCtrl.cpp(141) : warning C4554: '&' : check operator precedence for possible error; use parentheses to clarify precedence
d:\MyApps\PlotCtrl\PlotCtrl.cpp(161) : warning C4244: 'argument' : conversion from 'double' to 'int', possible loss of data
d:\MyApps\PlotCtrl\PlotCtrl.cpp(175) : warning C4244: 'argument' : conversion from 'double' to 'int', possible loss of data
d:\MyApps\PlotCtrl\PlotCtrl.cpp(280) : warning C4244: 'argument' : conversion from 'double' to 'int', possible loss of data
d:\MyApps\PlotCtrl\PlotCtrl.cpp(280) : warning C4244: 'argument' : conversion from 'double' to 'int', possible loss of data
d:\myapps\plotctrl\plotctrl.cpp(76) : error C4716: 'PlotCtrl::ZoomAll' : must return a value
PlotCtrl: 1 file(s) built in (0:04.62), 4625 msecs / file, duration = 4657 msecs

There were errors. (0:04.73)
Need to add 'return *this;' at the end of function ZoomAll. After that the project was compiled successfully. The result you can show on the picture:
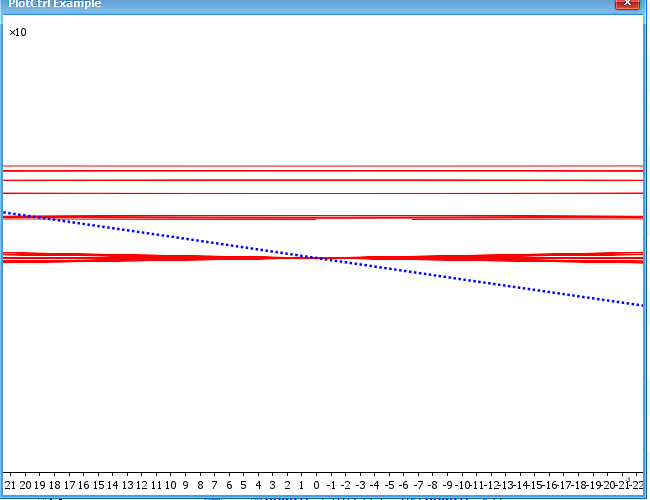
-
 Attachment: plot.png
(Size: 22.09KB, Downloaded 1394 times)
|
|
|
|
| Re: PlotCtrl [message #22857 is a reply to message #22855] |
Sat, 22 August 2009 20:21 |
|
|
Hello gridem,
Thank you very much for testing it on windows, I have only linux computer right now, so this really helps. For some reason GCC decided to be nice and didn't tell how stupid I am
| gridem wrote on Sat, 22 August 2009 14:12 |
d:\MyApps\PlotCtrl\PlotCtrl.cpp(7) : error C2084: function 'double abs(double)' already has a body
        E:\Program Files\Microsoft Visual Studio 9.0\Vc\Include\math.h(487) : see previous definition of 'abs'
|
This is my bad memory... I forgot that the absolute value function is fabs() not abs, so I wrote my own  When you removed it used the integer abs() - which very probably caused the ugly picture you attached. When you removed it used the integer abs() - which very probably caused the ugly picture you attached.
| gridem wrote on Sat, Sat, 22 August 2009 14:27 |
d:\myapps\plotctrl\plotctrl.cpp(76) : error C4716: 'PlotCtrl::ZoomAll' : must return a value
|
Well, this one I simply missed... Perhaps I should use -Wall with gcc to get warned about such mistakes.
I attached corrected version, it should work without any warnings now. Could you try to compile it, please? Thank you very much for your help.
Regards
Honza
[EDIT: Removed the file, see newest version below.]
[Updated on: Mon, 24 August 2009 10:16] Report message to a moderator |
|
|
|
|
|
| Re: PlotCtrl [message #22861 is a reply to message #22858] |
Sun, 23 August 2009 11:38 |
|
|
| koldo wrote on Sun, 23 August 2009 10:01 |
The code is rather slow. It requires to be compiled with the "Speed" option.
I do not know why compiling with "Debug" and "Speed" I get different initial screen (using MinGW)
|
Well, that is very interesting... I will try to get a computer with windows and test this with MinGW as soon as possible. At this moment I have no idea why the initial zoom should differ between different settings/compilers. I've just tried speed settings with gcc and it looks exactly the same as with debug. Also, none of the pictures you posted looks right, there must be something in MinGW that causes trouble in determining the scales.
Concerning the speed: it depends a lot on the number of datapoints in current view. And as I stated before, it is intended for static display, my applications usually compute something in orders of minutes up to days, so few more seconds to plot and save the results are not realy important That said, I have to note, that I'm still trying to optimize it as much as possible...
| koldo wrote on Sun, 23 August 2009 10:01 |
Zooming enough the horizontal axis numbers get mixed between them. It would be very good to avoid that by for example limiting the number of numbers in horizontal axis (just to choose something not perfect but simple)
|
I'm aware of that. I just did not decide yet how to work this around. I see basically two different solutions:
1) Limit the number of labels on axis, but this could lead in some cases to having just two (or even one) labels on axis, which could make the orientation much harder.
2) List the numbers in the form of offset + difference. This would make the axis easy to read, especially for measuring distances, but it's not really common in any software I know, so I'm not sure how the users would react. (Just for clarification: by offset + difference I mean something like 12500 on the end of axis and 5, 10, 15, 20, ... at the labeled positions)
It seems to me as a tough decision to choose between user friendliness and usability.
| koldo wrote on Sun, 23 August 2009 10:01 |
I think that the control would be more intuitive if the zoom wold be done by rolling the center wheel of the mouse
|
That should be quite easy to implement, I'll try to make it appear in next update. I just didn't feel the need for this feature, since I'm using primarily my laptops touchpad 
Thanks for your testing and suggestions.
Regards
Honza
|
|
|
|
|
|
| Re: PlotCtrl [message #22863 is a reply to message #22862] |
Sun, 23 August 2009 21:01 |
|
|
Hi Koldo,
Nice to hear some good news for a change That is how it should look like. I promise to fix it on windows too. Unfortunately I can't tell you when, because I'm abroad (for two more weeks) and have no windows machine here 
Regards,
Honza
|
|
|
|
| Re: PlotCtrl [message #22870 is a reply to message #22863] |
Mon, 24 August 2009 10:15 |
|
|
For everybody who is still interested in this widget, here is update.
Changes: Fixed cursor images. Now they show proper readouts from plot, with same scaling as on axis. Also added the requested mousewheel operated zooming. I'm just not sure what is more convenient direction - roll up or down to zoom? I've seen apps with either of those possibilities. So I just picked the one google maps use Also, I haven't tested it with a real mouse, since I have just touchpad, but I hope it'll work the same way. Left/right click for zoom still works, for people without wheel. ZoomAll is now bind on Ctrl-A as is usual in most programs (I believe). Now as I think about it, this maybe should be left on user, not to interfere with other possible key bindings in application...
The windows behavior is probably still buggy, and the same applies to axis labels.
Oh, and one more think I overlooked in one of previous posts: It doesn't have to be compiled with Speed option. The PlotCtrl.cpp is marked as compile for speed, so just Optimal should produce same results. Anyway, I agree, that the slowdown in Debug is significant.
Bye,
Honza
[EDIT: Removed the file, see newest version below.]
[Updated on: Sat, 26 September 2009 02:55] Report message to a moderator |
|
|
|
| Re: PlotCtrl [message #22884 is a reply to message #22818] |
Mon, 24 August 2009 19:28 |
pveach1
Messages: 10
Registered: August 2009
|
Promising Member |
|
|
I would like to see this project expanded into a general charting library. It has a lot of potential especially when combined with the new headless drawing capabilities.
Google has an online charting service. But if they change it, a lot of programs will break.
One of the more confusing things is setting coordinate transformation/translation. I am currently using Win32 API to set xformations. Like this:
XFORM xm_  = { 1, 0, 0, -1, FLOAT(size.cx -100), FLOAT(Offset + size.cy+50)};
HDC hdc = w.GetHandle();
SetGraphicsMode ( hdc, GM_ADVANCED );
SetWorldTransform ( hdc, & xm );
// do something
SetWorldTransform ( hdc, & xm_default ) ; // restore coordinates
This is only valid for WIN2k or later.
I am unsure how U++ draw does xforms.
|
|
|
|
| Re: PlotCtrl [message #22888 is a reply to message #22884] |
Mon, 24 August 2009 21:21 |
|
|
| pveach1 wrote on Mon, 24 August 2009 19:28 |
I would like to see this project expanded into a general charting library. It has a lot of potential especially when combined with the new headless drawing capabilities.
Google has an online charting service. But if they change it, a lot of programs will break.
One of the more confusing things is setting coordinate transformation/translation. I am currently using Win32 API to set xformations. Like this:
XFORM xm_  = { 1, 0, 0, -1, FLOAT(size.cx -100), FLOAT(Offset + size.cy+50)};
HDC hdc = w.GetHandle();
SetGraphicsMode ( hdc, GM_ADVANCED );
SetWorldTransform ( hdc, & xm );
// do something
SetWorldTransform ( hdc, & xm_default ) ; // restore coordinates
This is only valid for WIN2k or later.
I am unsure how U++ draw does xforms.
|
Hi pveach1,
So you suggest to split this into two packages, one containing X independent plotting and second just widget to plot it to for use in GUI? Well, that is an interesting point. It should be possible in principle. I'll definitely think of it and try to implement it.
About the xformations: I haven't used win32 API for years, but if I understand, the snippet you posted just reverses y axis and moves the origin of coordinates, right? If I'm not mistaken, I've seen these capabilities in Painter (and even more, e.g. skew), not so sure about Draw. Anyway, right now, I'm calculating all the screen<->world transforms on painting, so all you really need is SetLimits(x_min,xmax,y_min,y_max) (the y axis is always heading up).
Does that answer your questions?
Bye,
Honza
|
|
|
|
| Re: PlotCtrl [message #22898 is a reply to message #22888] |
Tue, 25 August 2009 23:37 |
|
|
Hi,
Good news for everyone interested! As I already said in last post, I liked the idea of having a package for headless charting as pveach1 suggested. So I gave it a try and split the code into PlotLib package, introducing type Plot, which can be used in console apps and PlotCtrl that only utilizes display of Plot.
Please be aware, that the code might be a bit slower than before and that bugs are likely to appear. Also the documentation is not up to date this time, since there was so many changes...
In the archive below, you will find PlotCtrlExample as usualy and newly also PlotLibExample, which plots the very same picture, but in console mode (saving the result into ~/plot.png). I haven't tried it on any truly headless machine, so feedback is more than welcome. But to my best knowledge, it should work
Regards,
Honza
[EDIT: Removed the file, see newest version below.]
[Updated on: Sat, 26 September 2009 02:54] Report message to a moderator |
|
|
|
| Re: PlotCtrl [message #23209 is a reply to message #22898] |
Sat, 26 September 2009 02:52 |
|
|
Hi everybody!
It's been a long time since last update... I'm sorry, but I had some work elsewhere. I'm proud to announce fresh release of PlotLib and PlotCtrl, with some brand new features:
PlotLib:- Class Legend to render legend
- Displaying data as Lines AND/OR Symbols
- Class PlotSymbol representing data symbols and providing common base to easily define your own
- Much more complete API (no more direct accessing to members, chaining)
PlotCtrl:- Class LegendCtrl to display legend
- Panning using middle mouse button
The documentation is unfortunately still outdated, but most of the methods should be selfexplaining. I hope I'll find time to document everything soon.
I'll be glad for any feedback you can give me
Regards,
Honza
-
 Attachment: Plot.zip
(Size: 20.60KB, Downloaded 459 times)
|
|
|
|
| Re: PlotCtrl [message #23517 is a reply to message #22884] |
Mon, 26 October 2009 09:22 |
 |
mirek
Messages: 14265
Registered: November 2005
|
Ultimate Member |
|
|
| pveach1 wrote on Mon, 24 August 2009 13:28 |
I would like to see this project expanded into a general charting library. It has a lot of potential especially when combined with the new headless drawing capabilities.
Google has an online charting service. But if they change it, a lot of programs will break.
One of the more confusing things is setting coordinate transformation/translation. I am currently using Win32 API to set xformations. Like this:
XFORM xm_  = { 1, 0, 0, -1, FLOAT(size.cx -100), FLOAT(Offset + size.cy+50)};
HDC hdc = w.GetHandle();
SetGraphicsMode ( hdc, GM_ADVANCED );
SetWorldTransform ( hdc, & xm );
// do something
SetWorldTransform ( hdc, & xm_default ) ; // restore coordinates
This is only valid for WIN2k or later.
I am unsure how U++ draw does xforms.
|
Any plotting package IMHO should use Painter.
See PainterExamples, that is selfexplaining code covering all details, including transformation matrices.
Mirek
|
|
|
|
| Re: PlotCtrl [message #24124 is a reply to message #23209] |
Sun, 27 December 2009 18:24 |
|
|
| dolik.rce wrote on Sat, 26 September 2009 03:52 |
Hi everybody!
It's been a long time since last update... I'm sorry, but I had some work elsewhere. I'm proud to announce fresh release of PlotLib and PlotCtrl, with some brand new features:
PlotLib:- Class Legend to render legend
- Displaying data as Lines AND/OR Symbols
- Class PlotSymbol representing data symbols and providing common base to easily define your own
- Much more complete API (no more direct accessing to members, chaining)
PlotCtrl:- Class LegendCtrl to display legend
- Panning using middle mouse button
The documentation is unfortunately still outdated, but most of the methods should be selfexplaining. I hope I'll find time to document everything soon.
I'll be glad for any feedback you can give me
Regards,
Honza
|
Hello Honza,
Exists any updates?
|
|
|
|
| Re: PlotCtrl [message #24142 is a reply to message #24124] |
Mon, 28 December 2009 18:06 |
|
|
| tojocky wrote on Sun, 27 December 2009 18:24 |
Hello Honza,
Exists any updates?
|
Hi Tojocky!
Thanks for your interest! There has been few changes, but I had to pause this project for a while. I might put the code here "as is" if you are interested, but I'm not even sure if everything works correctly right now.
Anyway, I plan to get back to PlotCtrl (and hopefuly finish it:)) during February. If everything goes well, I should even publish here full application designed for plotting arbitrary data.
Best regards,
Honza
|
|
|
|
Goto Forum:
Current Time: Sun Jul 06 03:37:41 CEST 2025
Total time taken to generate the page: 0.03645 seconds
|
|
|


 Members
 Pages
Pages Help
Help Register
 Login
Login Home
Home


")
