|
|
|
ScatterDraw Overview
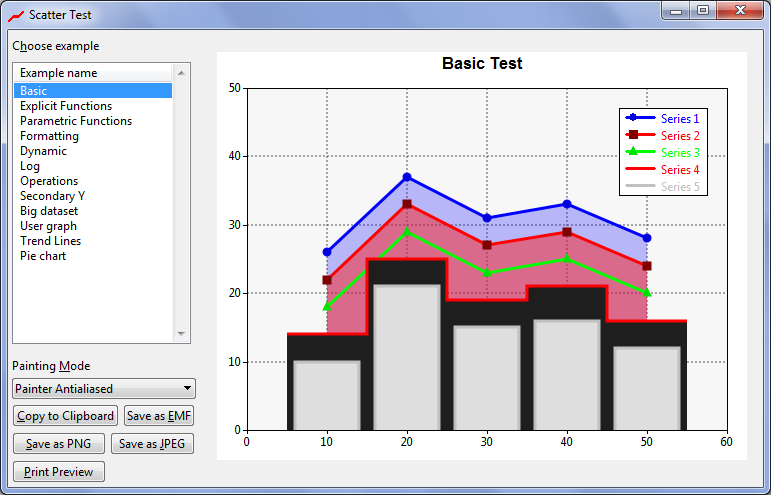
ScatterCtrl_Demo package does a visual review of ScatterDraw and ScatterCtrl class features. Here there are some screenshots:
General view
Demo program contains control samples listed in left table.
All of them have different export possibilities like:
Print Preview
Export as PNG
Export as JPEG
Export as EMF
Copy to Clipboard
ScatterCtrl uses Painter or Draw as selected in Painting Mode.
|
|
|
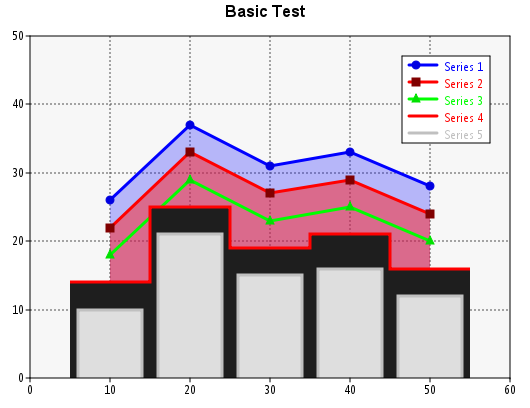
Basic Test
ScatterDraw lets to show different data series changing various parameters like color, line width or dot style.
|
|
|
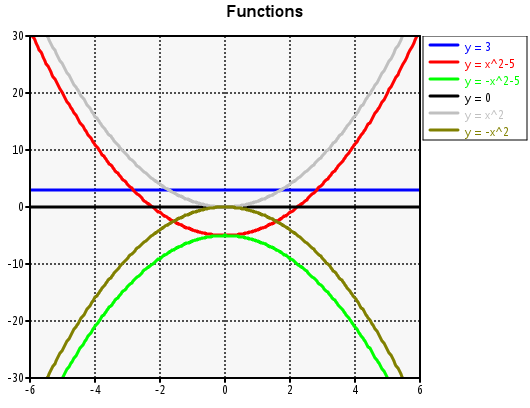
Functions
Using PlotFunction() it is possible to directly draw functions instead of just stored data.
|
|
|
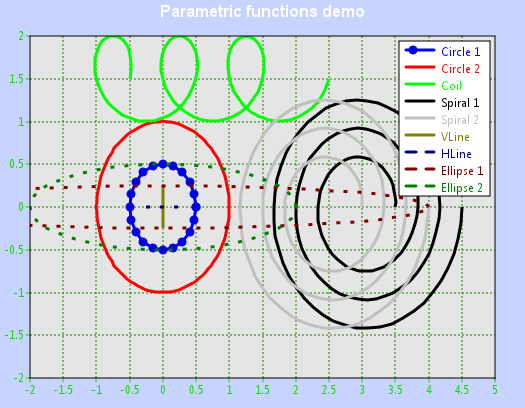
Parametric Functions
While PlotFunction() functions just return the vertical axis, PlotParaFunction() functions return the XY coordinates of every point.
This options lets full freedom inserting XY series.
|
|
|
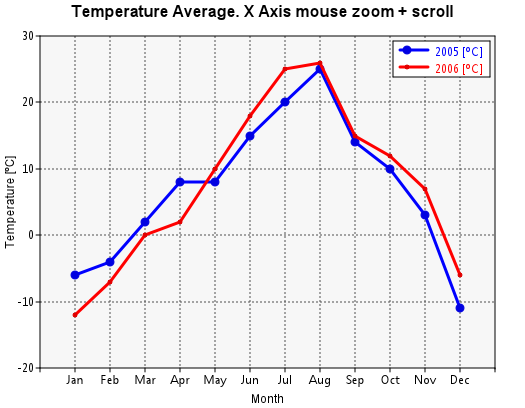
Formatting
ScatterDraw lets to insert X and Y labels, XY scaling and range, point format and size and standard or user defined axis labels formating.
In addition SetMouseHandling(true) lets to use the mouse to zoom and move the graphs in X axis.
|
|
|
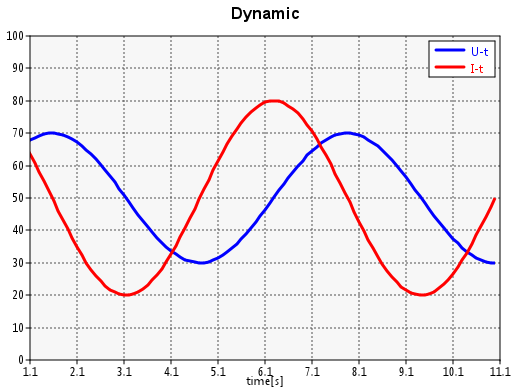
Dynamic
ScatterCtrl is not a static control and it easily lets to include moving series.
|
|
|
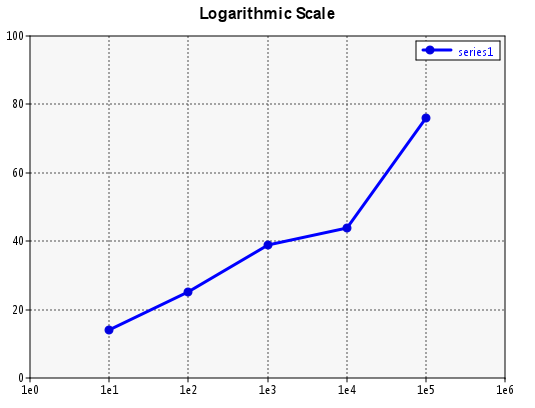
Logarithmic
Versatile axis scaling and labeling through cbModifFormatX and cbModifFormatY lets to include not only time and date axis but also logarithmic ones.
|
|
|
Operations
Series dynamic handling is easy. This demo lets the user to add and remove series at run time.
|

|
|
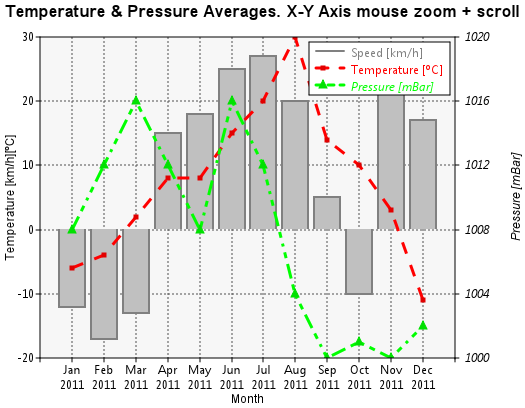
Secondary Y axis
It is possible to add a secondary right side vertical Y axis and scale data series to it. All secondary axis texts are in italic.
In addition SetMouseHandling(true, true) lets to use the mouse to zoom and move the graphs in X and Y axis.
|
|
|
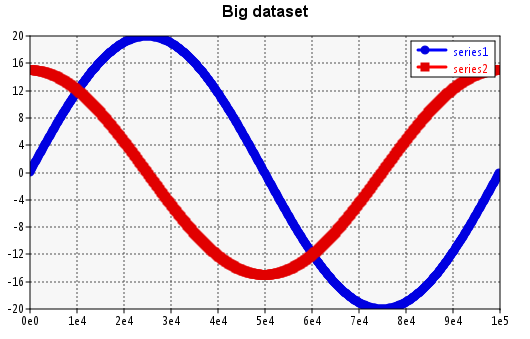
Big datasets
Big datasets are hard to handle. However there are two functions that speed up dramatically ScatterDraw/ScatterCtrl response in X axis sequential datasets like time series:
SetSequentialX: Indicates that the data has been sequentially inserted following X axis
SetFastViewX: Indicates that it will be viewed a point per horizontal pixel. This point will be the average of all data that is in that pixel
|
|
|
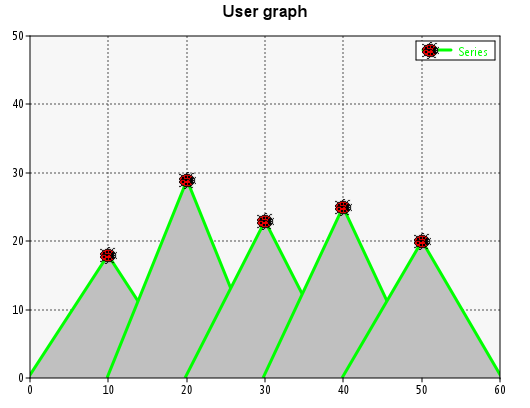
User Graphs
It is easy to create new series and mark plotting routines.
This a simple sample of deriving SeriesPlot and MarkPlot into new user plotting primitives.
|
|
|
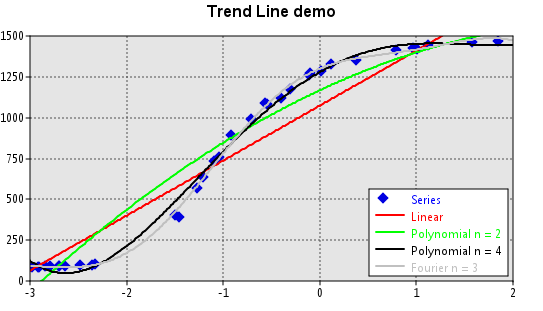
Trend Lines
It is possible to fit a user data series into a known equation linear (LinearEquation), polynomial (PolynomialEquation), Fourier (FourierEquation) or others.
Just declare the equation type and fit it to the data series. This equation behaves as any other DataSeries so you can have full access to it including adding it to ScatterDraw and ScatterCtrl.
|
|
|
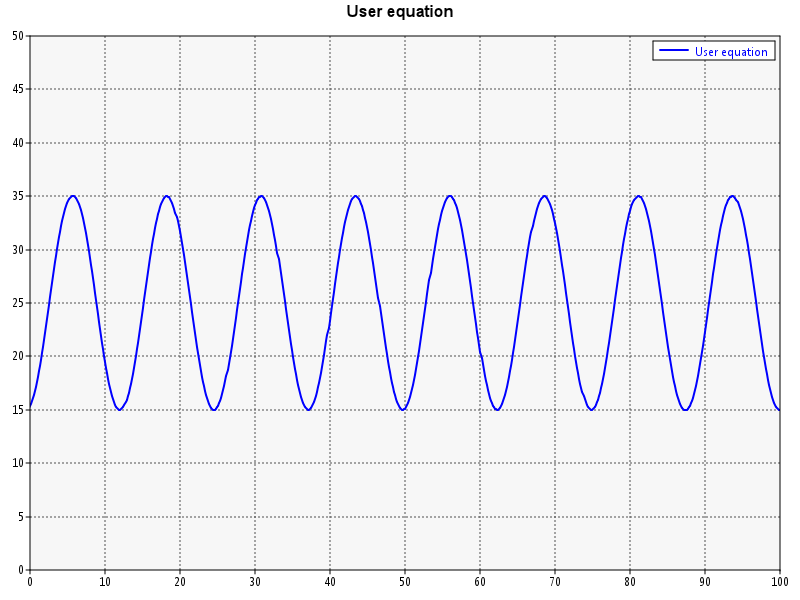
User equation
User entered equations by text can be plotted. In addition, as they are also Dataset, raw data series can be Fit() to user equations.
UserEquation is based on EvalExpr class.
|
|
|
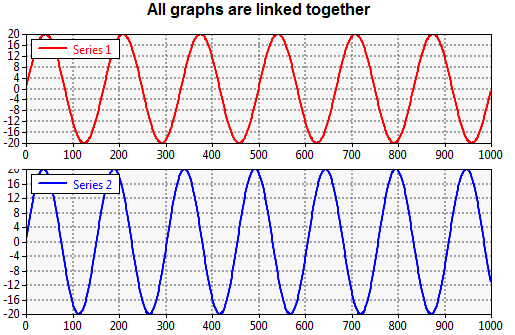
Linked controls
It is possible to fit different plots with LinkedWith() so that any scroll or zoom in any graph will affect the rest of them.
|
|
|
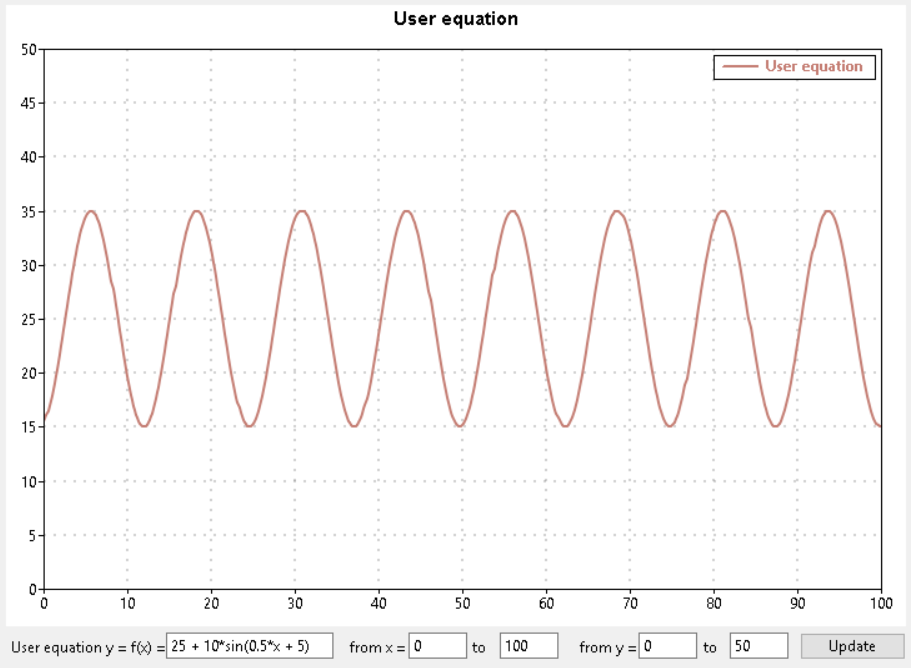
User equation
UserEquation allows to enter user Strings as equations to process and plot them.
|
|
|
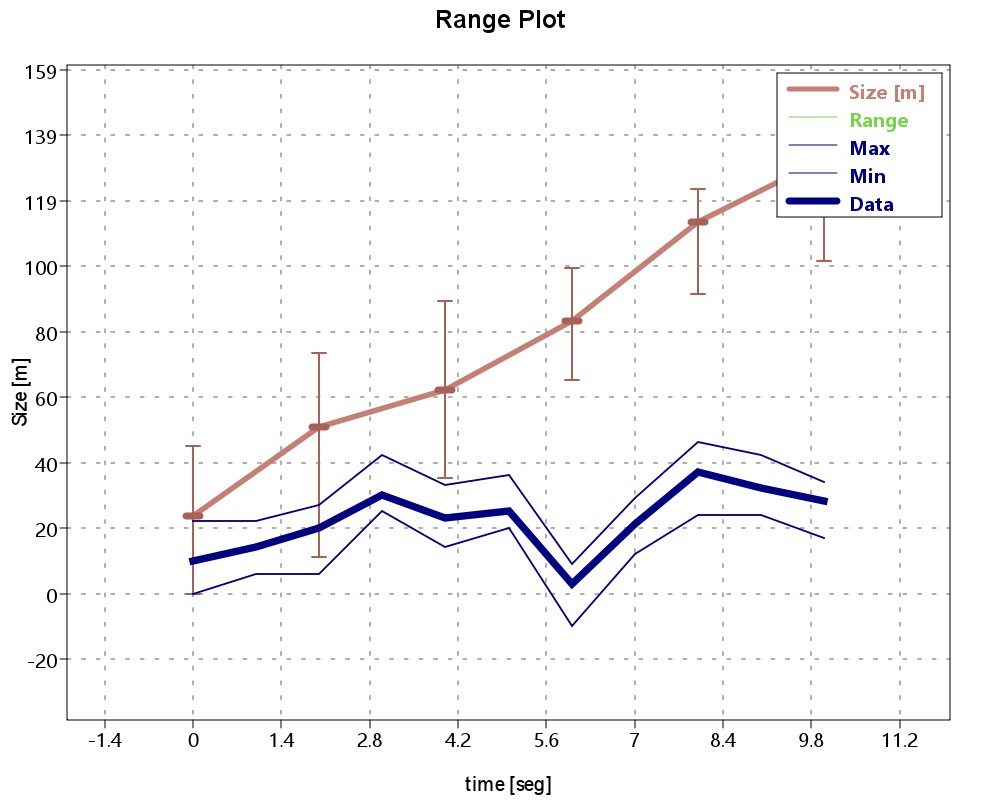
Range plot
RangePlot is a multi valued MarkStyle to include not just a value but some of them and upper and lower values surrounding it.
Possible RangePlot values are:
ALL: Paints all values
MIN_MAX: Paints just min and max values
MIN_AVG_MAX; Paints min, max and average values
|
|
|
Stacked plot
The values of different series matching same x values can be added creating "stacked" plots.
In addition, Set100() method forces all series values to sum value 100.
|

|
|
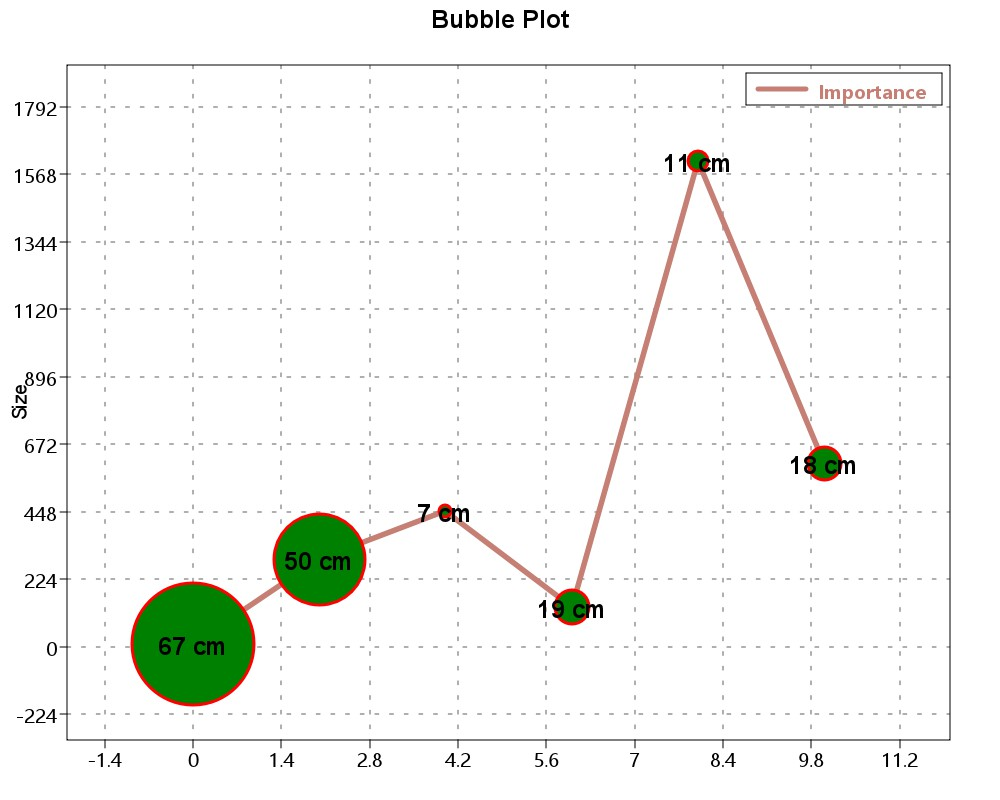
Bubble plot
MarkStyle BubblePlot allows to include multi valued MarkStyle including the bubble radius.
|
|
|
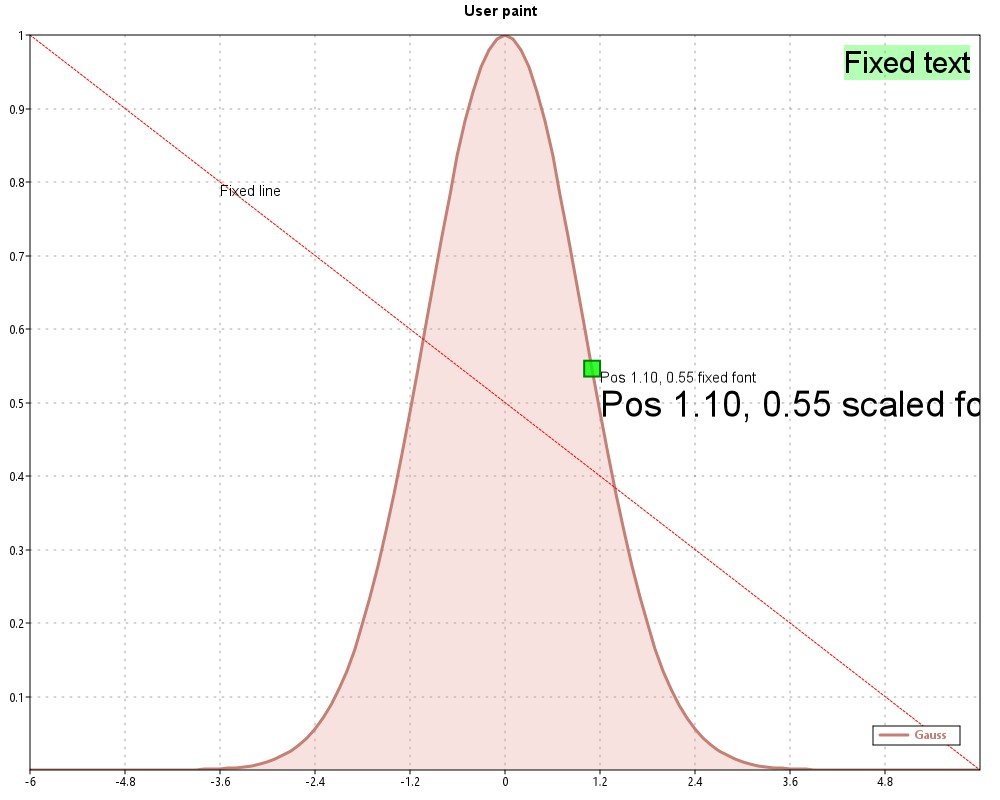
User paint
WhenPainter and WhenDraw functions allow to paint using Painter or Draw different shapes using pixel based scale or real scatter plot scale.
|
|
|
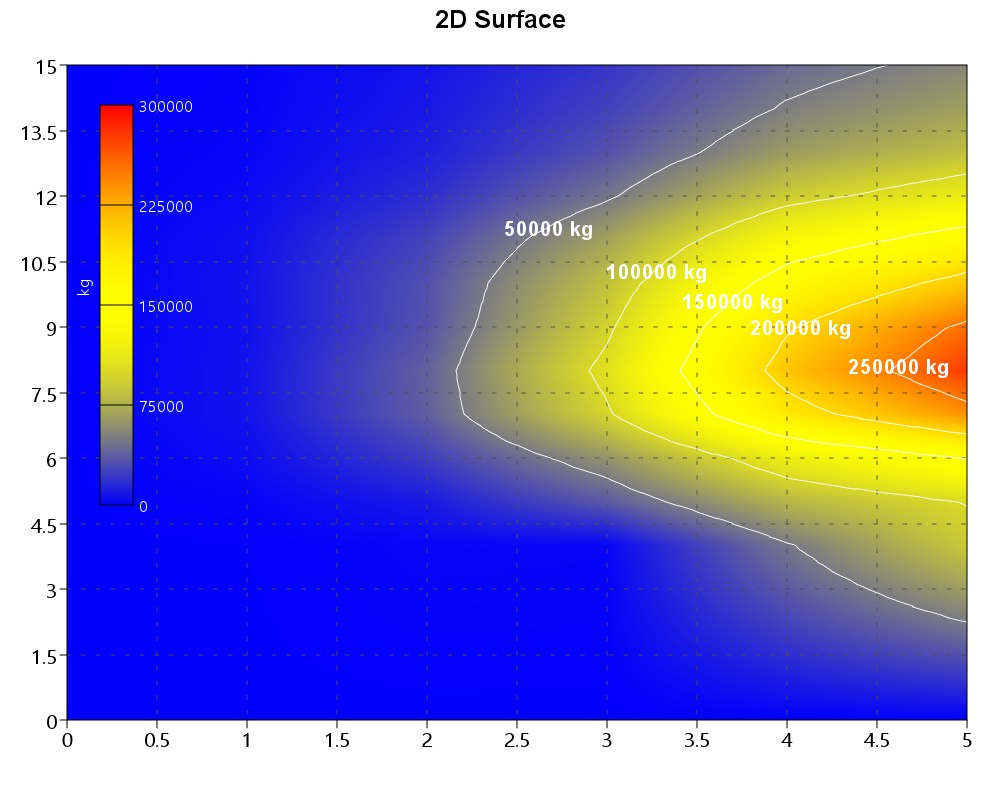
2D surface
A 2D surface and legend including different rainbow color structures can be added to normal scatter plots.
New functions have been added to manage isoline calculation and legend plot on scatter series.
|
|
|
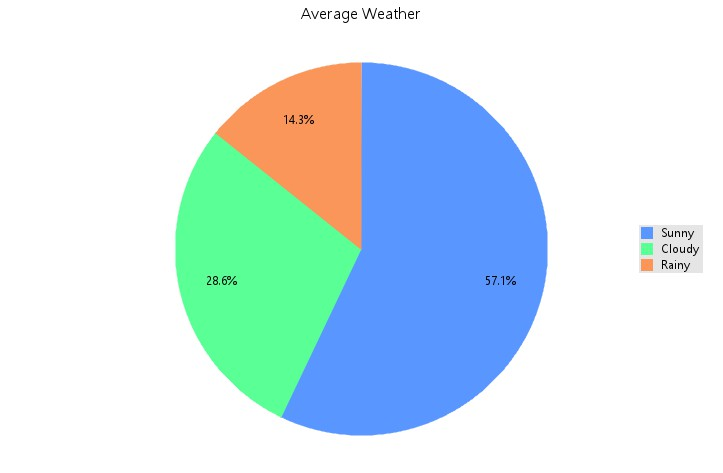
Pie Chart
A basic experimental PieChart plot is included with values and legend.
|
|
|
|
|
|