Resolving memory leaks in U++ applications
Table of contents
1. Introduction
2. Debugging leaks
3. False positives
1. Introduction
Before 2008.1 release, the memory leaks debugging facilities have changed. Here we try to explain why logic has changed and what problem is it supposed to solve:
Previous method involved watching for particular ADDRESS to be allocated (so that you could determine the source of leak). Anyway, that has a problem than often the same memory block is going to be allocated more than one time - obviously, in that case the watch would only catch the first allocation, which would not be the cause of the problem. That is why logic was improved by introducing "memory allocation serial number".
The memory leaks mechanisms only applies to U++ Core based application. When you develop non U++ applications in TheIDE, the detection mechanism will not be present.
2. Debugging leaks
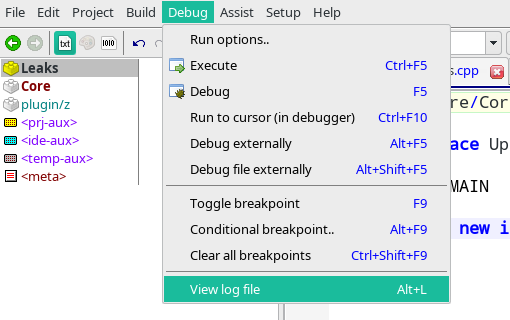
In "memory allocation serial number" each memory allocation has associated serial number (incremental). When U++ detects a leak, it dumps all leak blocks (note that sometimes you can resolve the problem just by examining its content) to standard .log file. You can see it in TheIDE by pressing Alt+L or by selecting "View log file" option from "Debug" menu:
In the .log, serial number is printed for each leaked memory block. It is printed after "--memory-breakpoint__":
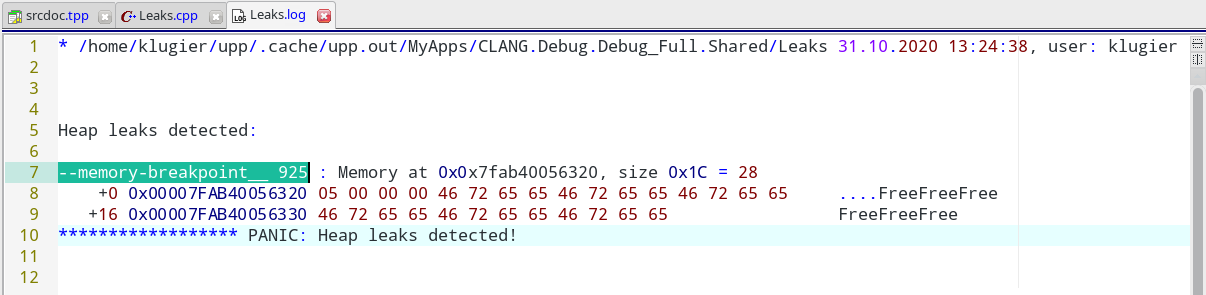
Now the only thing you need to do is to add "void MemoryBreakpoint(dword serial)" call to your application source code. For the case above the serial parameter should 925. When Alloc for that serial happens again, __BREAK__ will segfault ("*(void *)0 = 0") the application and you will be able to catch the problem in the debugger. The code that will detect the leak could look like this:
#include <Core/Core.h>
using namespace Upp;
CONSOLE_APP_MAIN
{
MemoryBreakpoint(925); // <- The earlier you place this instruction the better
int* a = new int(5); // <- Debugger should break in this line
}
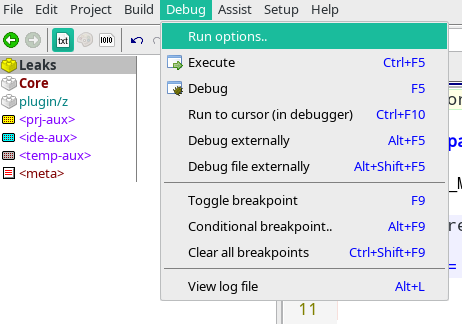
The alternative approach assumes that the "--memory-breakpoint__" is passed as a program argument. In this case there is no need to modify source code. To do it open "Run options" dialog from "Debug" menu:
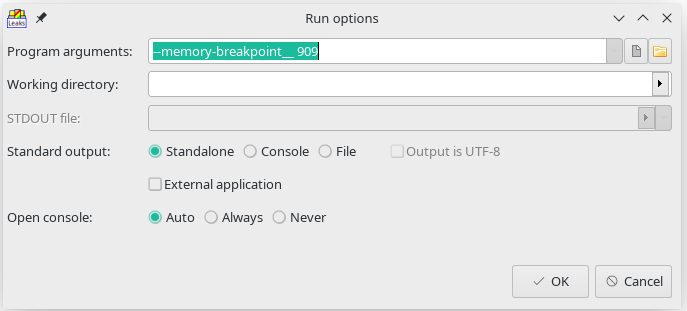
Now the window where command line arguments for application can be specified should appears. In this case we need to add "--memory-breakpoint__ ${serial_number}" as argument. In our example serial number is 925:
Of course, the only problem with this is that the order of allocations must be exactly the same in the "test run". Which is often not, but usually it is possible to arrange it so after spending a couple of nights desperately looking for the source of leak in the code using other methods. So make sure that the serial number is still valid! In might be correct for several applications debug sessions, but in the end it will expire.
3. False positives
There is a very memory situation when memory leak can not be fixed by the programmer. For example the external library is used and there is not full control over it. Sometimes the operating system drivers leaks could be treated as leaks. To avoid such false positives U++ library provides ignoring mechanisms.
The first one is the pair of function MemoryIgnoreLeaksBegin() and MemoryIgnoreLeaksEnd(). The below example show how to avoid leak detection:
#include <Core/Core.h>
using namespace Upp;
CONSOLE_APP_MAIN
{
MemoryIgnoreLeaksBegin();
int* a = new int(5);
MemoryIgnoreLeaksEnd();
}
The alternative simpler approach is to used MemoryIgnoreLeaksBlock structure. On construction it starts ignoring and on destruction it cancels ignoring statement. This is the classical RAII pattern. Example below:
#include <Core/Core.h>
using namespace Upp;
CONSOLE_APP_MAIN
{
{
MemoryIgnoreLeaksBlock __;
int* a = new int(5); // <- This leak will be ignored
}
int* b = new int(10); // <- This leak will be catched
}
The memory leak detection mechanisms should be use with caution. In the vast majority of cases detections means that something is wrong in the application source code.
|